Abstract
Motivation. Before implementing a Faraday cage to reduce electrical jitter, we tested whether darkness alone (from being covered by a cardboard box) affects the electrical signals. This experiment compares an uncovered baseline period with a covered (box) condition to isolate the effect of darkness before adding electromagnetic shielding.
Approach. We extracted data from InfluxDB for three time windows: uncovered baseline (06–12 Nov 2025), covered with cardboard box (13–17 Nov 2025), and post-removal recovery (17–24 Nov 2025). The same 10-minute → hourly reducer and clustering methodology from Experiments 001 and 001A was applied to all windows for direct comparison.
Limitations. There is a ~1.5 day gap between uncovered and covered windows, different durations (6 days vs 4 days vs 7 days), and DHT temperature/humidity data was not recorded despite the sensor being placed inside the box. We cannot distinguish between effects of darkness vs. environmental changes (temperature, humidity) inside the box.
Results. Diurnal electrical rhythms persist under all three conditions (uncovered, covered, post-removal). The same two spatial clusters (Group 1: morning peaks; Group 2: evening peaks) appear in all windows, suggesting the circadian rhythm is not purely light-driven and is robust to darkness and recovery.
Conclusions & next steps. Quantitative analysis reveals that darkness produces state-dependent responses: Cluster B shows a massive +52.8% increase in mean activity, while Cluster A shows only a -1.6% decrease. Post-removal analysis shows Cluster B partially recovers (-9% from peak) but remains +39% above baseline, while Cluster A shows continued slight decline. Diurnal rhythms persist throughout all conditions, indicating we can proceed with Faraday cage implementation. The state-dependent response pattern suggests future experiments should consider baseline electrical state when interpreting stimulus responses.
Introduction
Understanding how environmental factors affect fungal electrical activity is critical for designing controlled experiments. Before implementing a Faraday cage (aluminum foil covering) to reduce electromagnetic interference, we needed to test whether darkness alone—from being covered by a cardboard box—would affect the signals.
Experimental Design:
- Uncovered window: 2025-11-06 04:00:00 (UTC) – 2025-11-12 05:00:00 (UTC) — Regular block exposed to ambient light (baseline)
- Covered window: 2025-11-13 13:20:00 (UTC) – 2025-11-17 08:30:00 (UTC) — Same fungus covered with cardboard box (before aluminum foil was added)
- Post-removal window: 2025-11-17 08:30:00 (UTC) – 2025-11-24 08:30:00 (UTC) — Box removed, 7 days of recovery data collected
A DHT sensor was placed inside the box to monitor temperature and humidity changes, though DHT data was not successfully recorded during these windows.
Materials & Methods
Data Acquisition
Raw voltage readings (≈2 s cadence) were pulled directly from the InfluxDB bucket blocks_raw for ESPs 01, 05, 08, 11, 13, 14, 16, and 17 during all three time windows. The helper script extract_experiment_003_range.py issues per-ESP Flux queries and writes tidy CSVs to analysis/fungal_state_mapping/outputs/experiment_003_darkness/CSV/ (organized into uncovered/, covered/, and post_removal/ subdirectories). ESP04 and ESP09 were offline during all windows.
Signal Processing
- Direct export. Flux queries return tidy tables with
time_utcand electrode fields (a0–a3,d01,d23). Timestamps are normalized to UTC. - Local-time resampling. Timestamps are converted to Costa Rica local time (UTC−6) and resampled to 10-minute intervals, then averaged to hourly means.
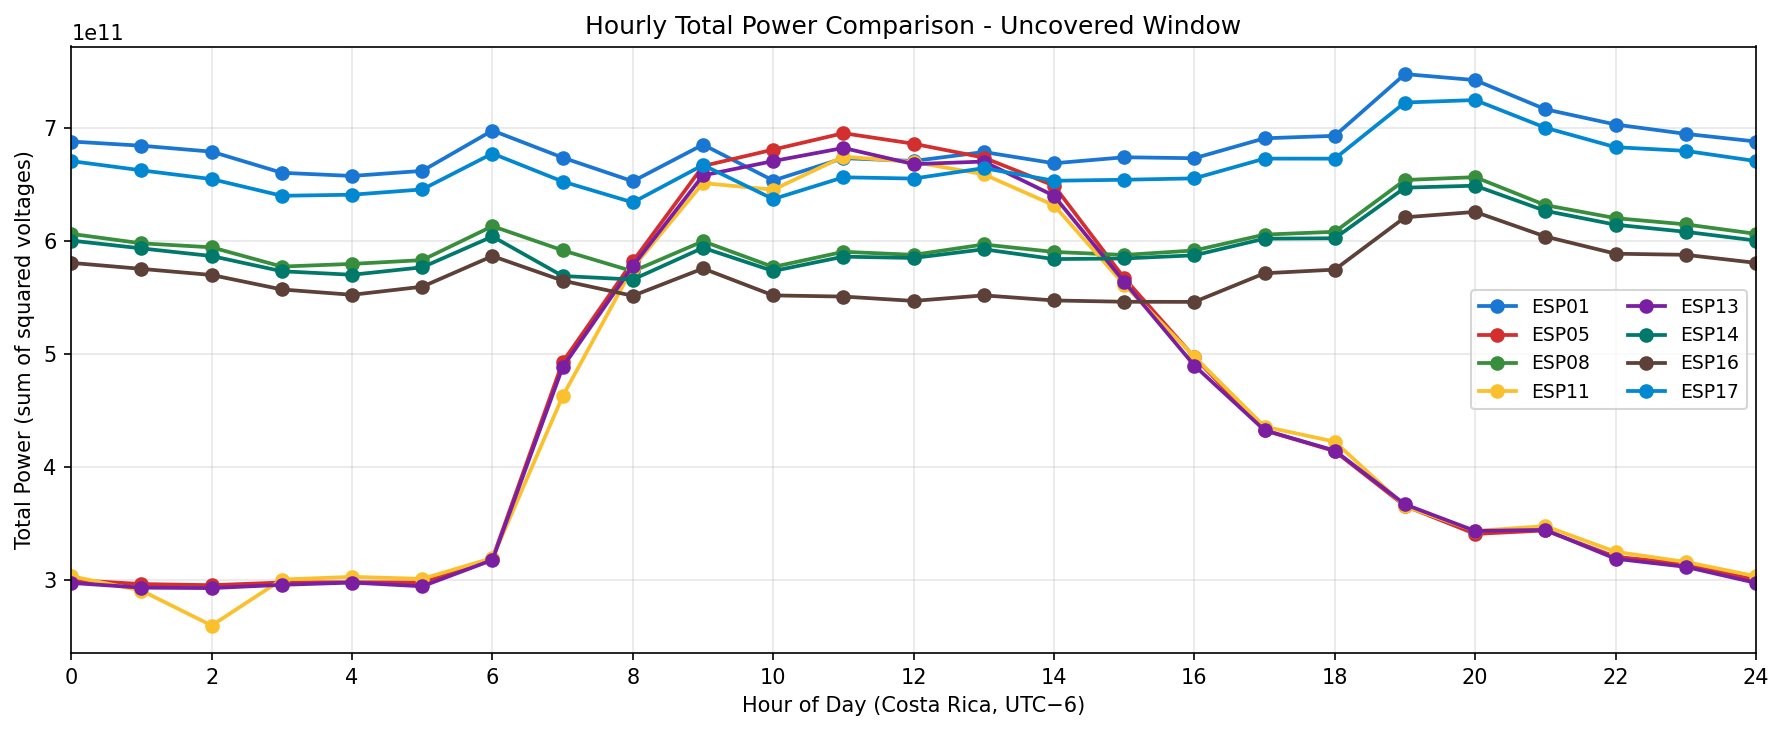
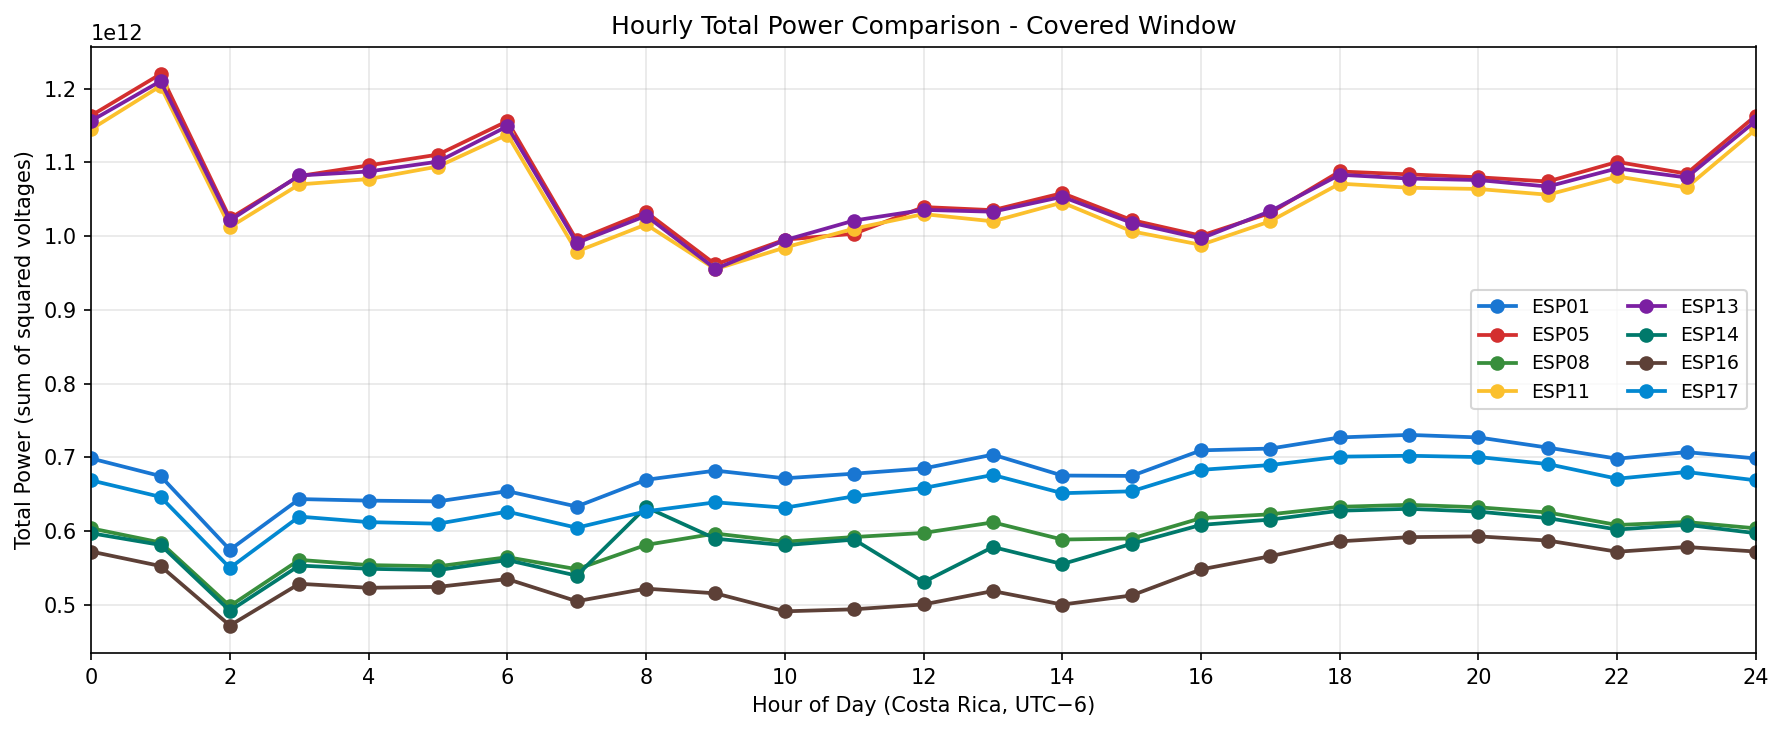
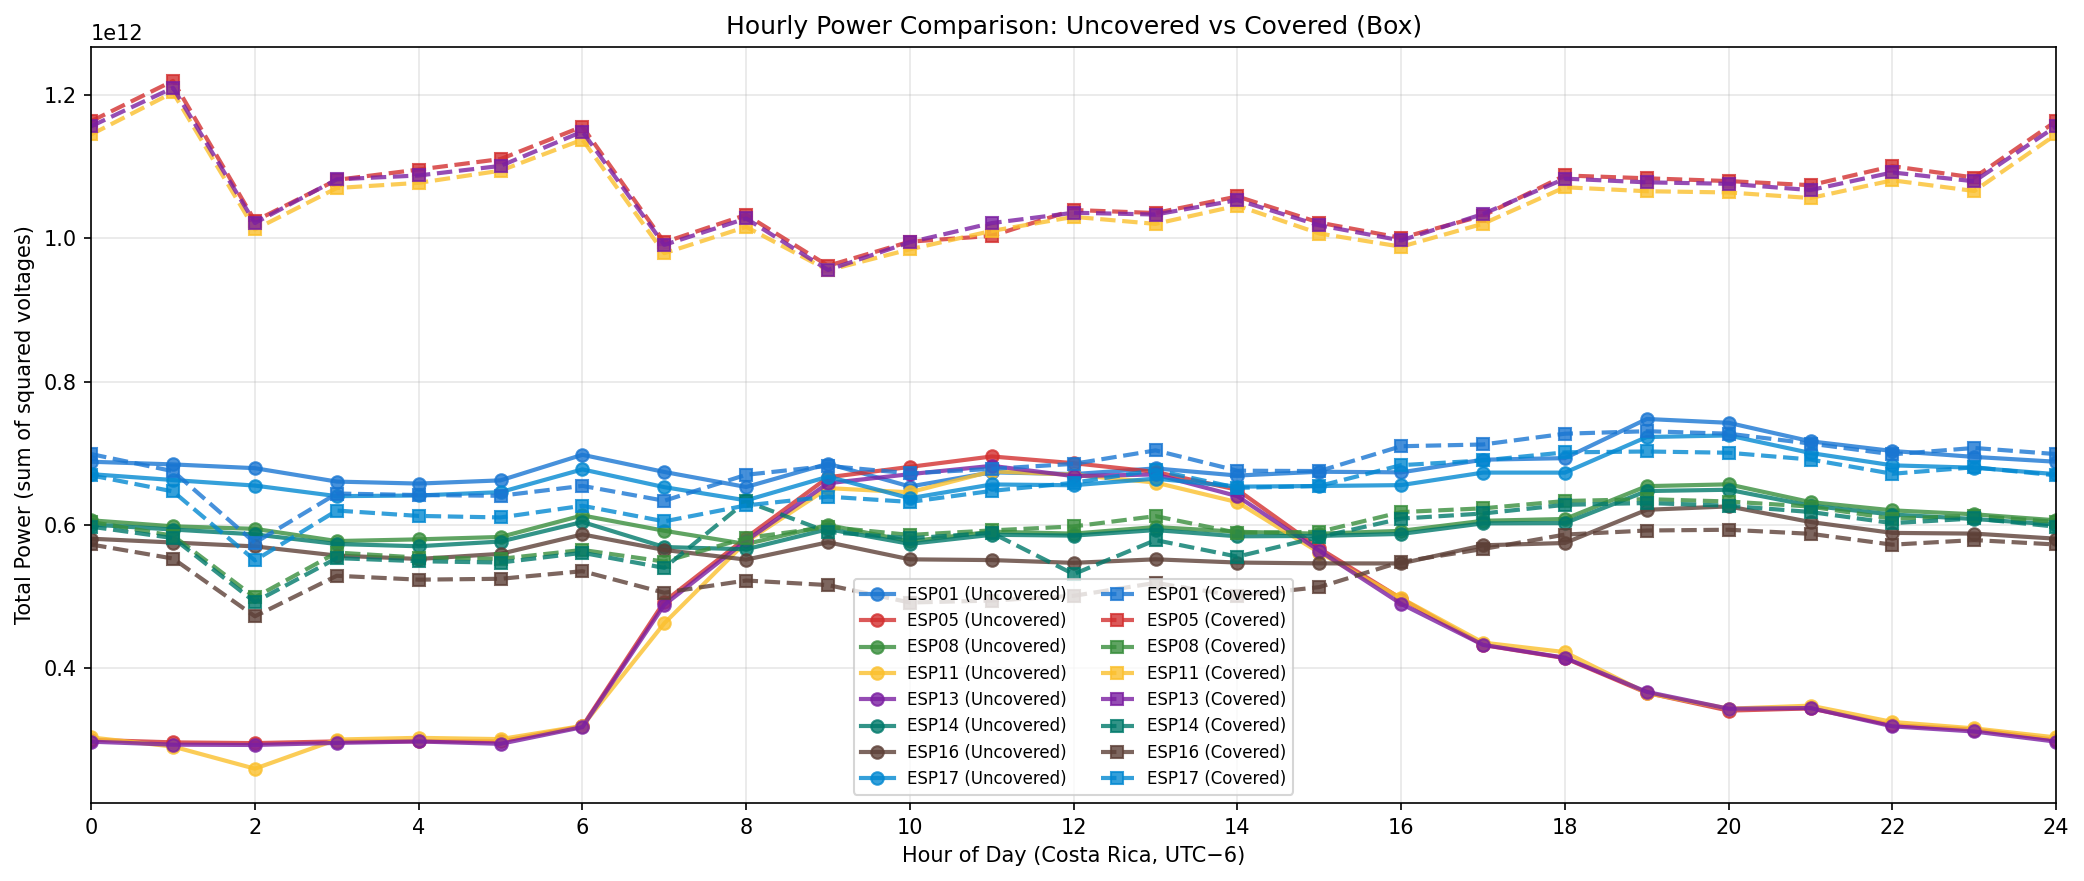
- Comparison. Hourly cycles and power spectra are computed separately for uncovered, covered, and post-removal windows, then compared directly (two-way and three-way comparisons).
Software
Processing relied on Python 3.11, Pandas, Matplotlib, and Requests for InfluxDB access. Scripts: extract_experiment_003_range.py, generate_experiment_003_plots.py.
Results
Data Coverage
Uncovered Window (06–12 Nov 2025):
- ESP01: 234,369 rows
- ESP05: 234,295 rows
- ESP08: 205,047 rows
- ESP11: 231,302 rows
- ESP13: 234,299 rows
- ESP14: 205,420 rows
- ESP16: 205,543 rows
- ESP17: 234,515 rows
- ESP04, ESP09: No data (offline)
Covered Window (13–17 Nov 2025):
- ESP01: 151,415 rows
- ESP05: 151,012 rows
- ESP08: 132,236 rows
- ESP11: 151,216 rows
- ESP13: 151,189 rows
- ESP14: 132,082 rows
- ESP16: 132,413 rows
- ESP17: 151,195 rows
- ESP04, ESP09: No data (offline)
Post-Removal Window (17–24 Nov 2025):
- ESP01: 273,857 rows
- ESP05: 274,037 rows
- ESP08: 236,194 rows
- ESP11: 273,629 rows
- ESP13: 274,252 rows
- ESP14: 240,512 rows
- ESP16: 240,124 rows
- ESP17: 274,205 rows
- ESP04, ESP09: No data (offline)
DHT Data: Temperature and humidity data from dedicated DHT ESP (esp-dht.local) available for covered (139,161 readings) and post-removal (537,826 readings) periods. No DHT data for uncovered baseline period.
Uncovered Window Analysis
Covered Window Analysis
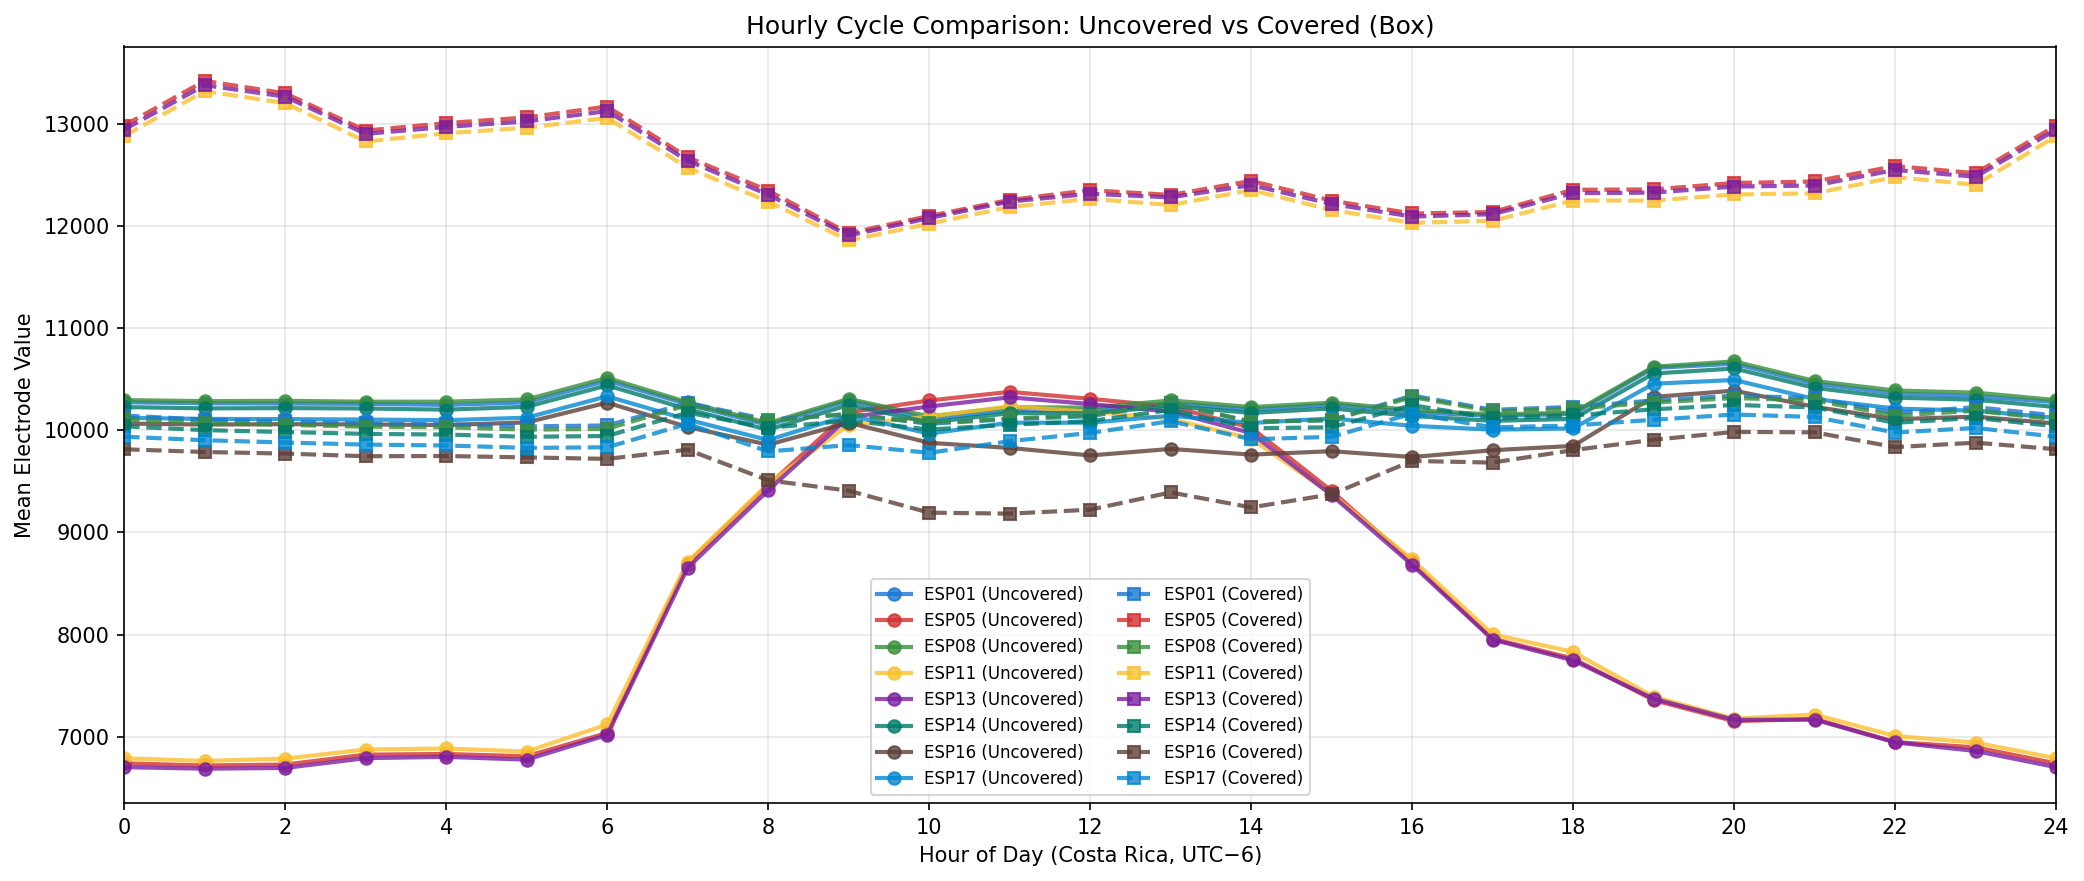
Direct Comparison: Uncovered vs Covered
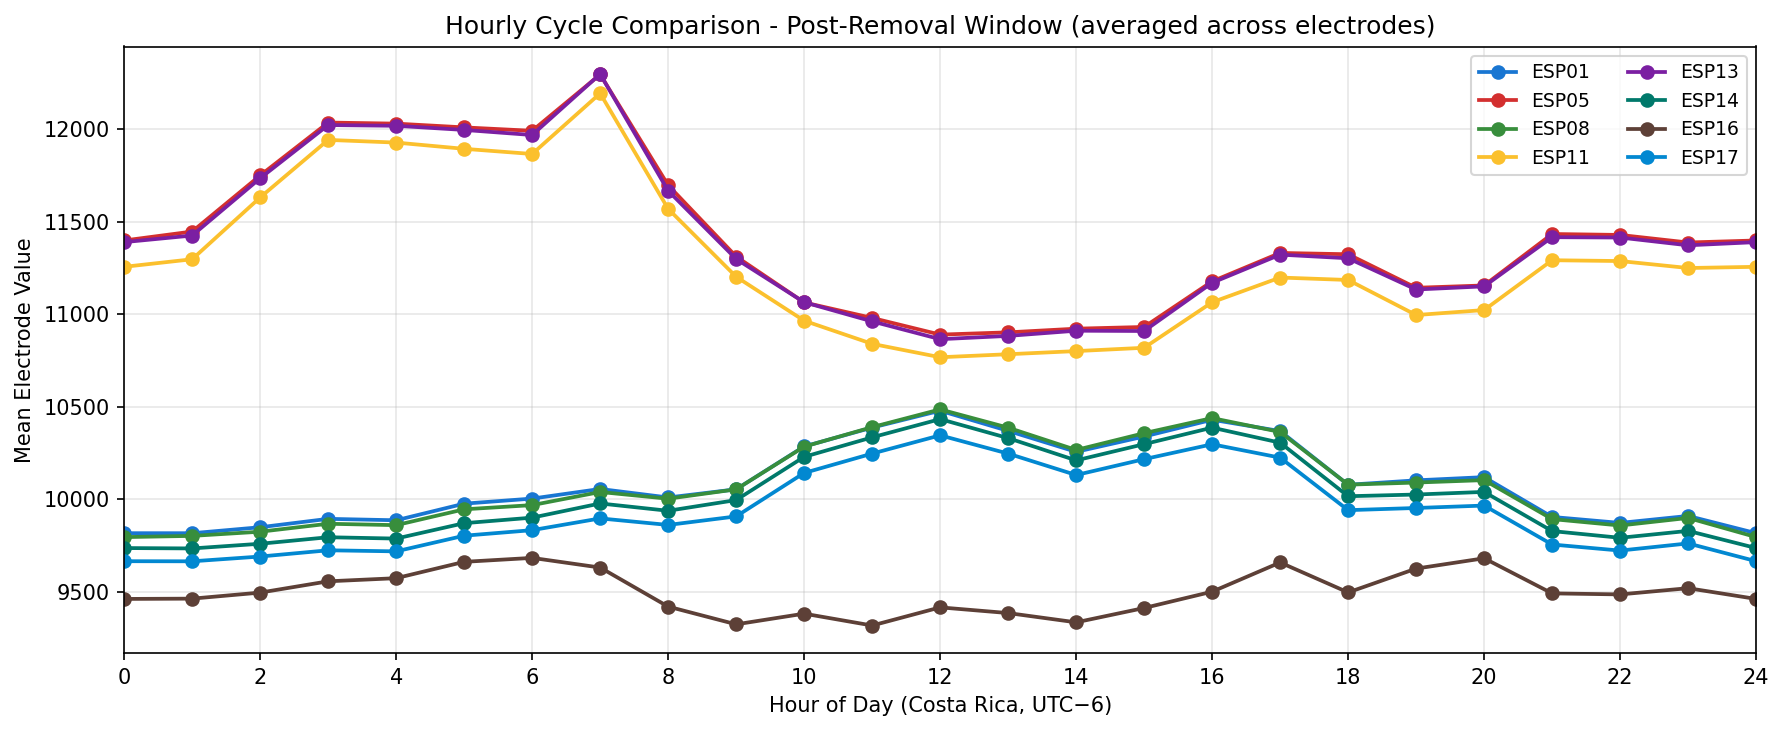
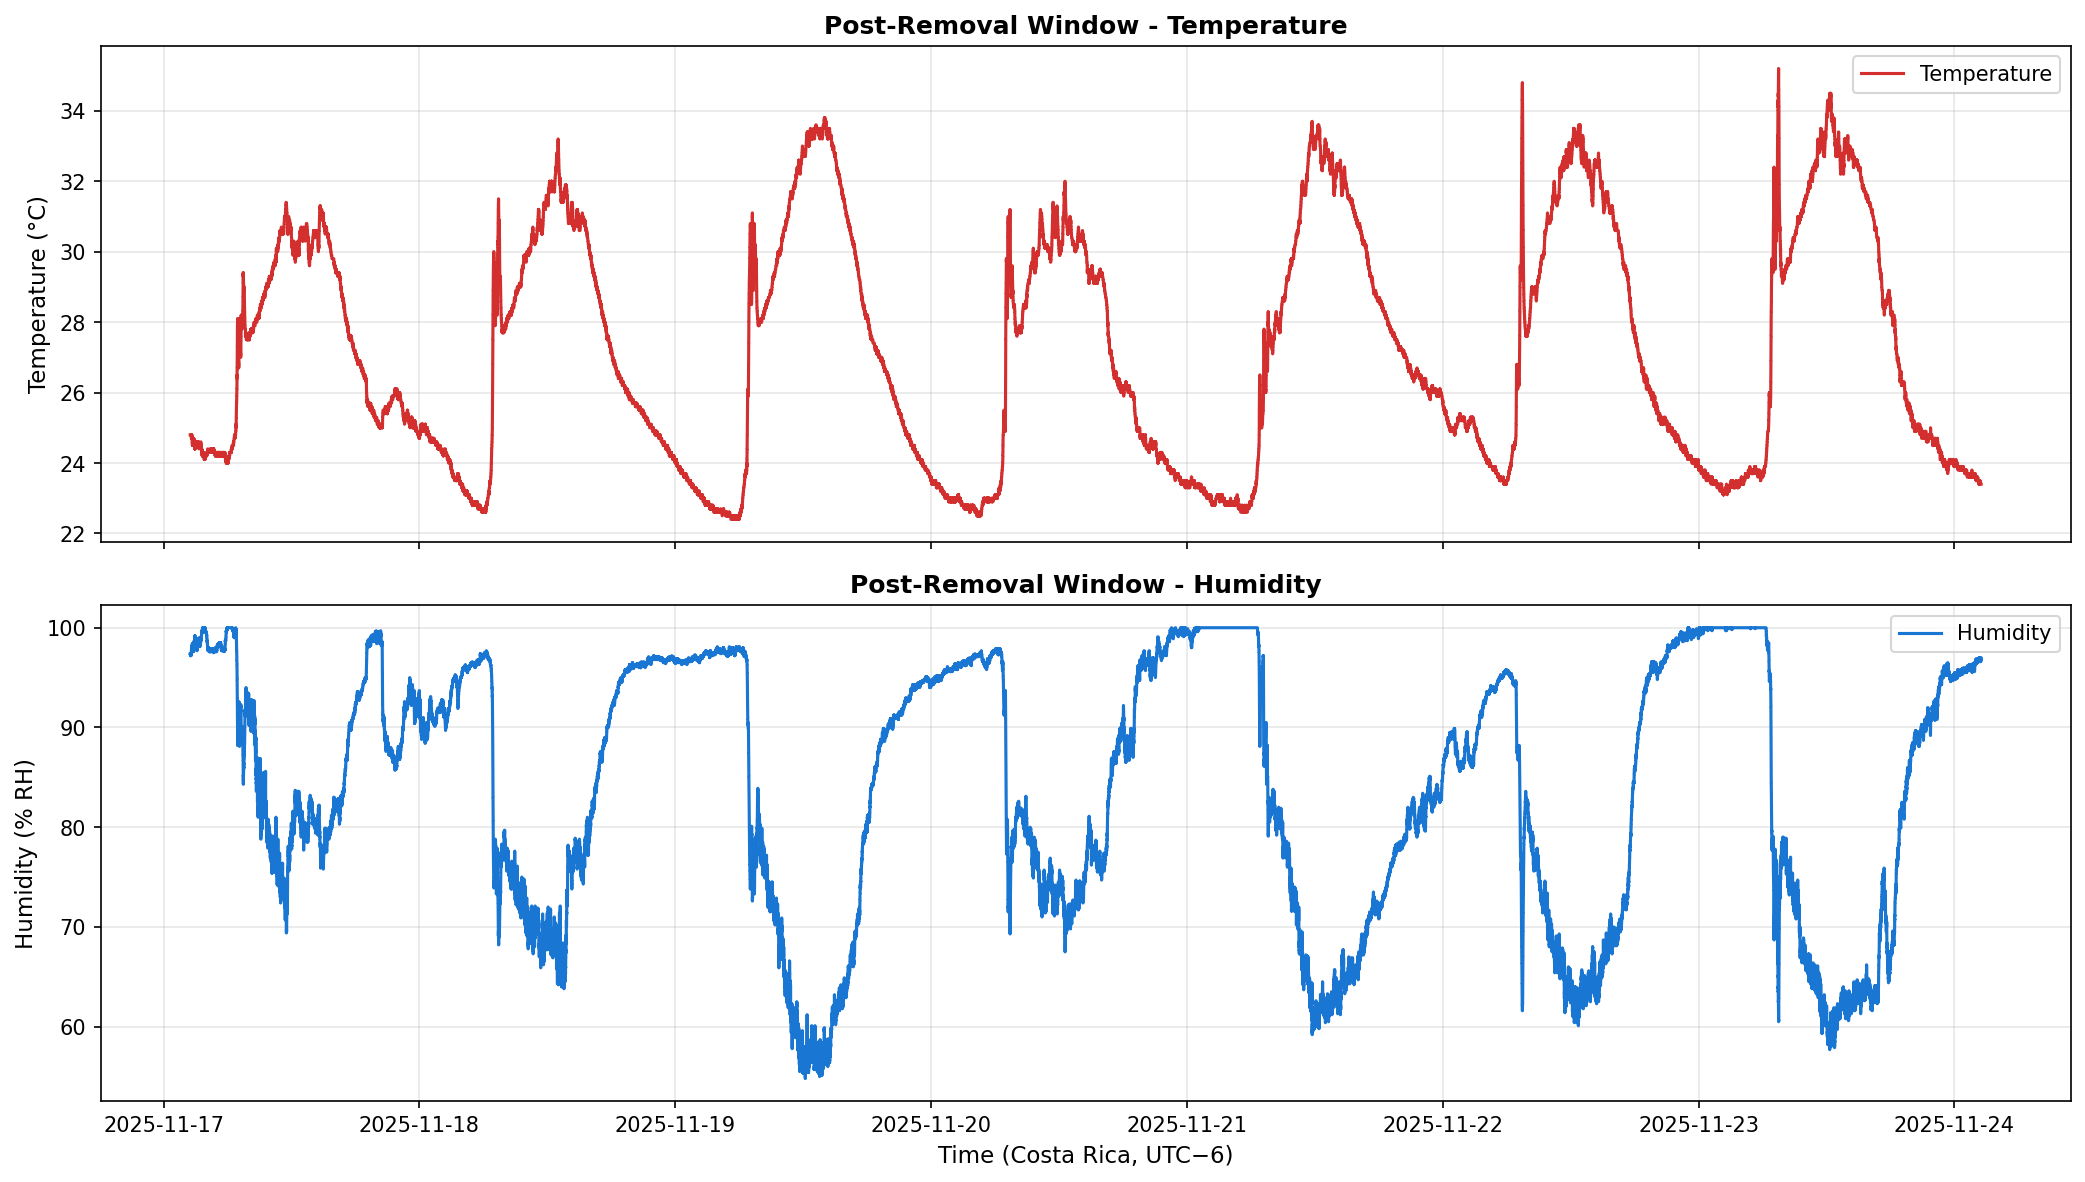
Post-Removal Window Analysis
On 2025-11-17 08:30:00 (UTC), the cardboard box was removed. Data was collected for 7 days post-removal (until 2025-11-24 08:30:00 UTC) to assess recovery of diurnal patterns.

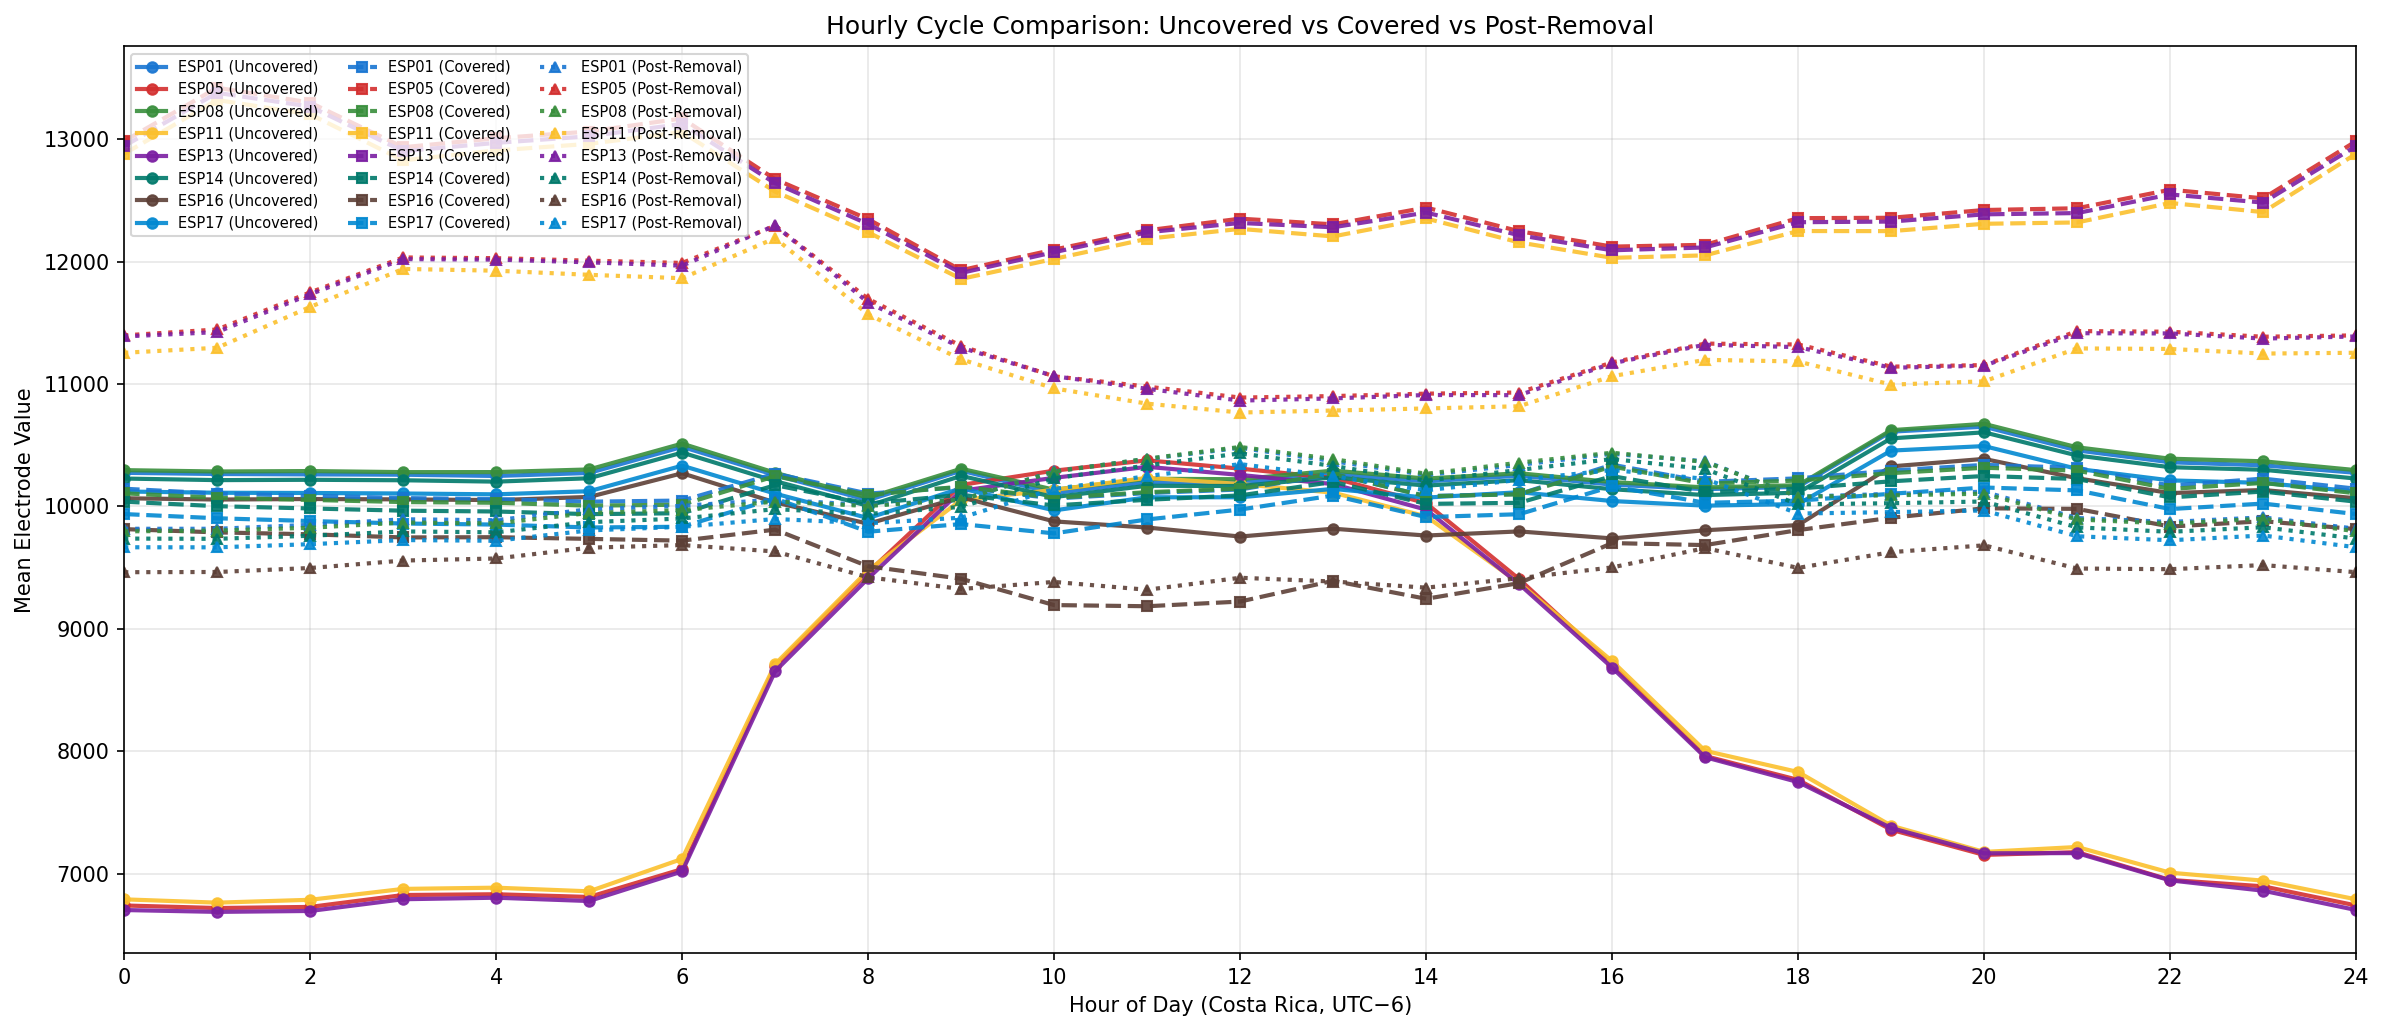
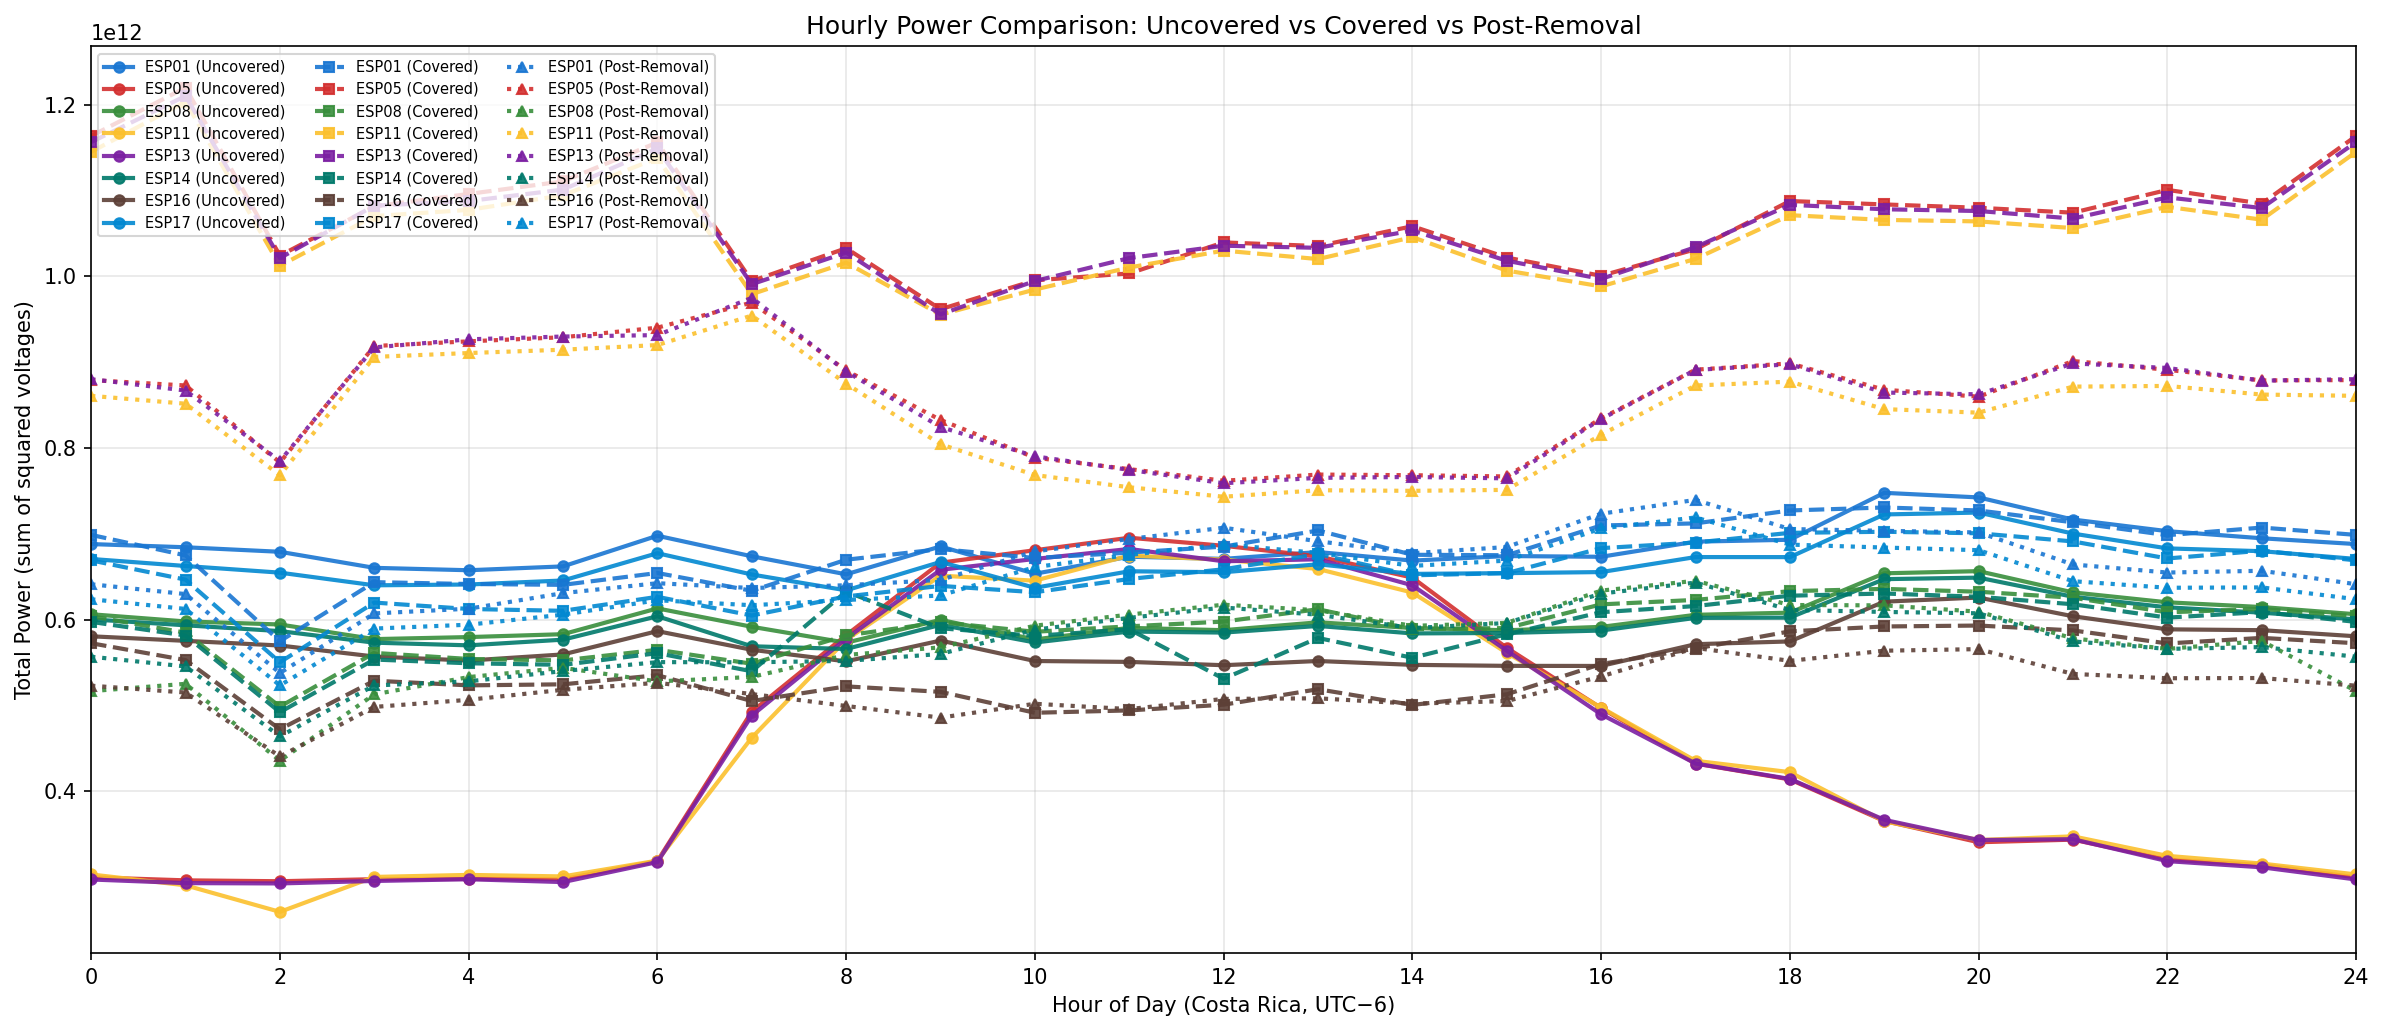
Three-Way Comparison: Uncovered vs Covered vs Post-Removal
Analysis & Findings
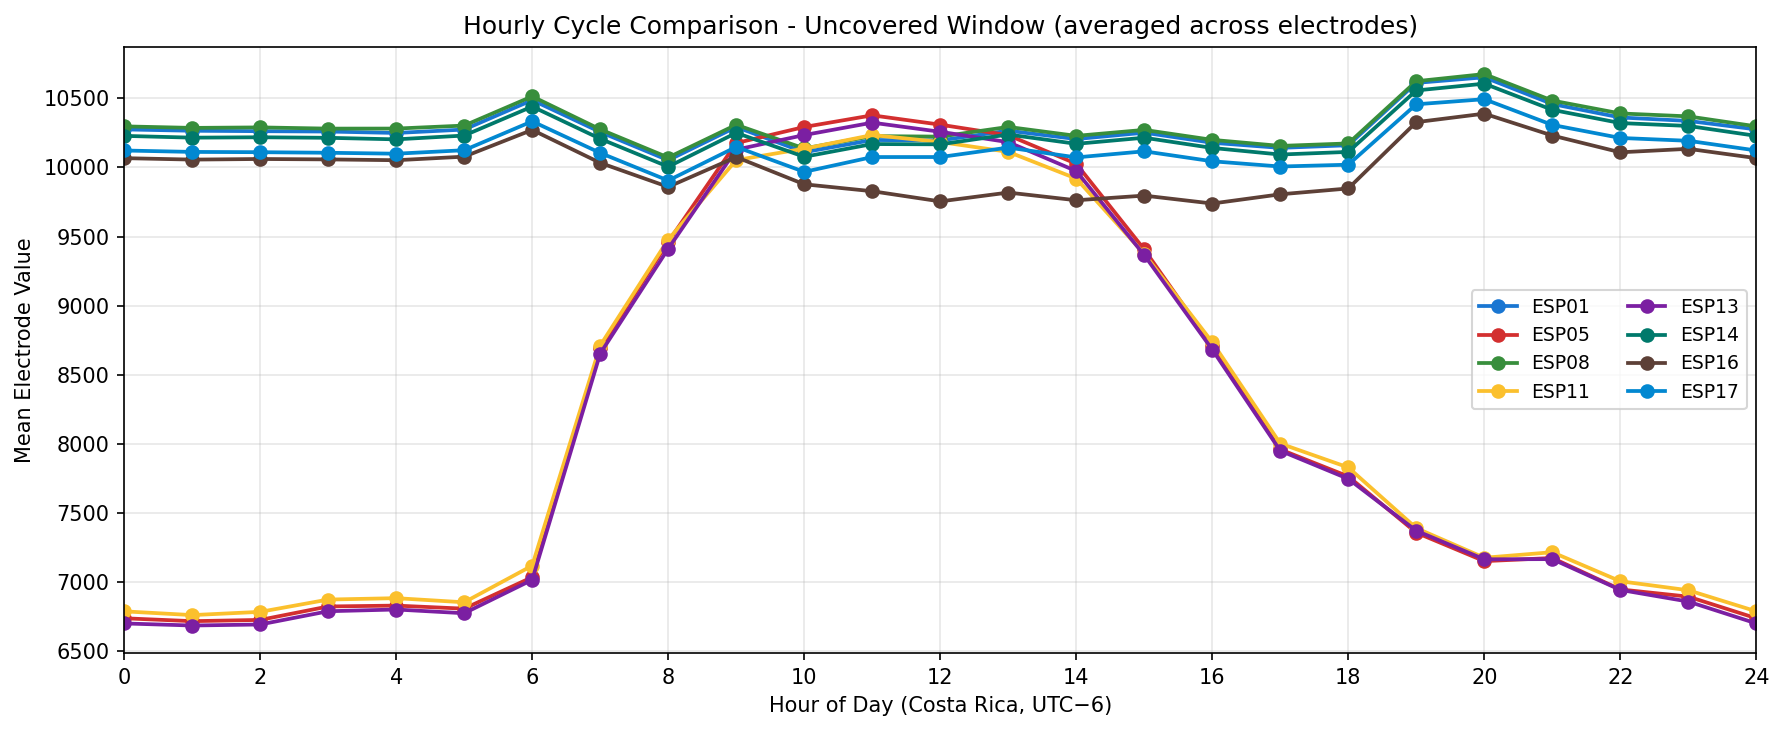
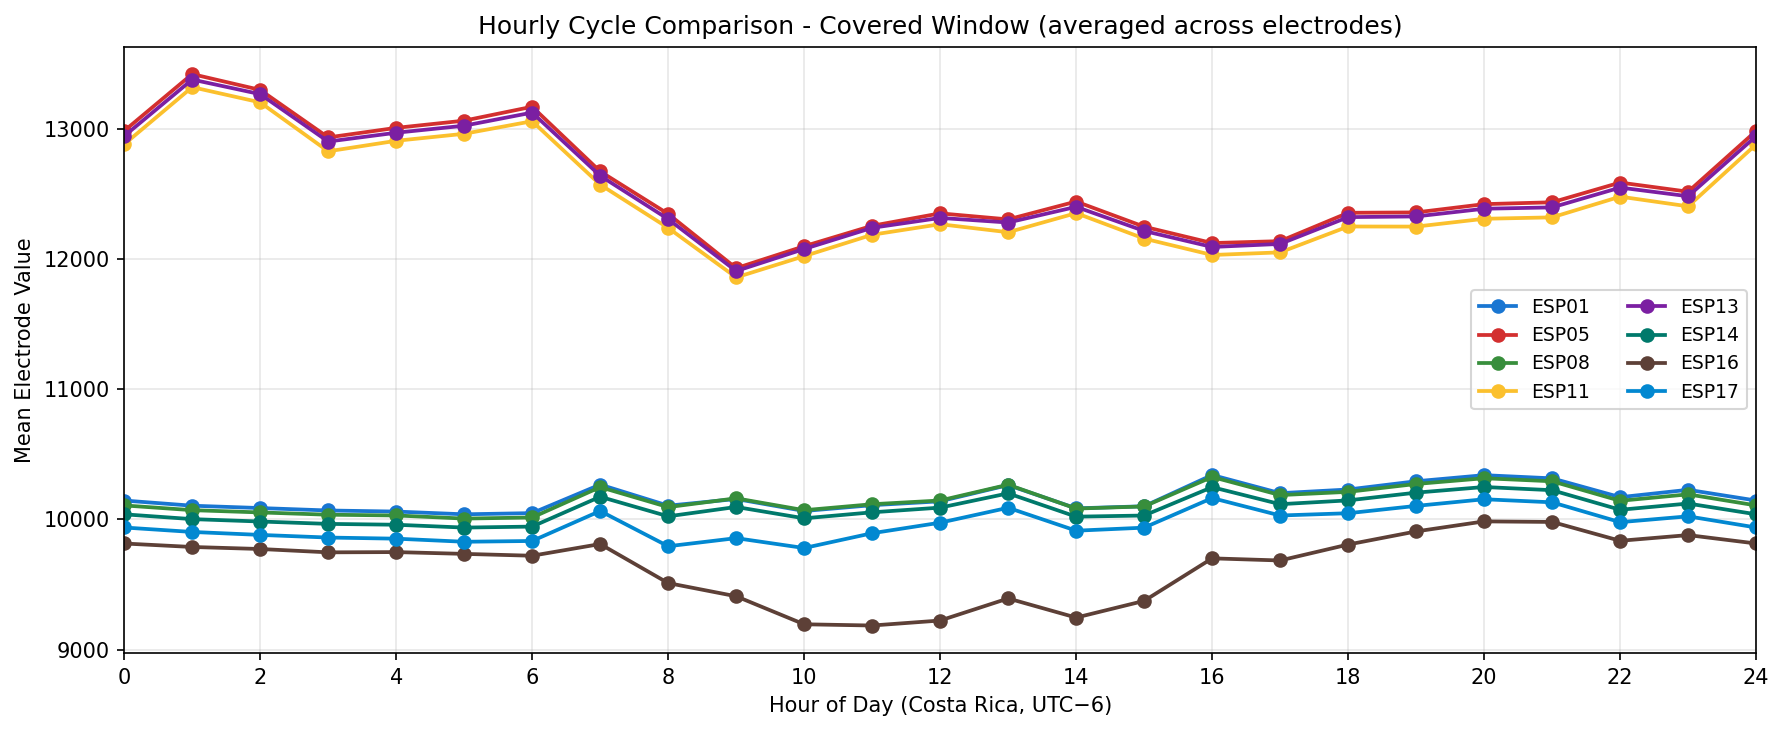
Pattern preservation. Visual inspection of Figures 5–6 shows that the overall diurnal waveform shape is maintained in both uncovered and covered conditions. The timing of peaks and troughs appears similar, suggesting the circadian rhythm is not disrupted by darkness alone.
Spatial clustering maintained. The same two spatial clusters identified in previous experiments appear in both windows:
- Group 1 (ESP05/11/13): Morning peak pattern (~11:00)
- Group 2 (ESP01/08/14/16/17): Evening peak pattern (19:00–20:00)
This suggests that spatial organization of electrical states is robust to the darkness condition.
Amplitude differences. Some ESPs show different absolute voltage levels between conditions, but this could be due to:
- Time gap between windows (~1.5 days)
- Natural biological variation
- Environmental changes (temperature, humidity inside box)
- Hardware drift
Without DHT data, we cannot distinguish between effects of darkness vs. environmental changes.
Quantitative Analysis: State-Dependent Darkness Effects
Statistical Comparison
A comprehensive quantitative analysis was performed comparing all three conditions (uncovered, covered, post-removal), aggregating data by spatial cluster:
- Cluster A (Northern Arc): ESP17, ESP14, ESP08
- Cluster B (Western Block): ESP05, ESP11, ESP13
Data was aggregated using 10-minute window means, then comprehensive statistics were computed for each cluster under all three conditions. This allows us to assess:
- The initial effect of darkness (covered vs uncovered)
- Whether patterns returned to baseline after removal (post-removal vs uncovered)
- Recovery dynamics (post-removal vs covered)
Key Quantitative Results
Covered vs Uncovered (Darkness Effect)
| Metric | Cluster A | Cluster B |
|---|---|---|
| Mean Change | -1.58% | +52.83% |
| Effect Size (Cohen's d) | -0.50 | +2.53 |
Post-Removal vs Uncovered (Recovery Assessment)
| Metric | Cluster A | Cluster B |
|---|---|---|
| Mean Change | -2.05% | +39.11% |
| Effect Size (Cohen's d) | -0.54 | +2.14 |
Post-Removal vs Covered (Recovery Dynamics)
| Metric | Cluster A | Cluster B |
|---|---|---|
| Mean Change | -0.48% | -8.98% |
| Effect Size (Cohen's d) | -0.14 | -0.67 |
All comparisons: p < 0.0001 (Mann-Whitney U test)
Detailed Statistics
Cluster A (Northern Arc) Response:
- Uncovered Mean: 10,229.8 mV → Covered Mean: 10,068.1 mV → Post-Removal Mean: 10,020.0 mV
- Darkness Effect: -161.7 mV (-1.58%), Effect Size: -0.50
- Recovery Assessment: Post-removal is -209.8 mV (-2.05%) vs uncovered baseline, suggesting continued decline rather than recovery
- Recovery Dynamics: Post-removal is -48.1 mV (-0.48%) vs covered, indicating minimal change after box removal
- Interpretation: Cluster A shows minimal response to darkness, and post-removal values remain below baseline. This suggests Cluster A may have been in a declining state throughout the experiment, independent of the darkness intervention.
Cluster B (Western Block) Response:
- Uncovered Mean: 8,174.7 mV → Covered Mean: 12,493.0 mV → Post-Removal Mean: 11,371.8 mV
- Darkness Effect: +4,318.3 mV (+52.83%), Effect Size: +2.53 (very large positive effect)
- Recovery Assessment: Post-removal is +3,197.1 mV (+39.11%) vs uncovered baseline, indicating partial but incomplete recovery
- Recovery Dynamics: Post-removal is -1,121.3 mV (-8.98%) vs covered, showing a 9% reduction from the darkness peak but still 39% above baseline
- Interpretation: Cluster B shows dramatic response to darkness (+52.8%), and post-removal shows partial recovery (-9% from peak) but remains significantly elevated (+39% vs baseline). This suggests Cluster B was in a highly responsive state when darkness was applied, and the effect persisted even after removal.
Recovery Analysis
Key Finding: The diurnal rhythm persisted throughout all three conditions, but the quantitative effects show different recovery patterns:
- Cluster A: Minimal response to darkness, continued slight decline post-removal (not a recovery effect)
- Cluster B: Massive response to darkness (+52.8%), partial recovery post-removal (-9% from peak, but still +39% above baseline)
This suggests that while the diurnal pattern is robust and persists regardless of condition, the absolute activity levels show state-dependent responses that do not fully recover within 7 days.
State-Dependent Hypothesis
Hypothesis: The differential response suggests that darkness, like other stimuli, produces responses that depend on the current electrical state of the mycelial network. Without explicit state definitions (as proposed in Experiment 001), we cannot determine the exact states, but the data strongly suggests:
- Cluster A and Cluster B were in different electrical states at the time of the darkness intervention
- Cluster B was in a state that made it highly responsive to darkness
- Cluster A was in a state that made it relatively unresponsive to darkness
- This state-dependent response pattern may explain variability in other stimulus experiments
Full Quantitative Tables
For detailed statistics including quartiles, skewness, kurtosis, and distribution comparisons, see:
View Full Quantitative Analysis Tables →
Tables include:
- Complete statistical comparison for Cluster A
- Complete statistical comparison for Cluster B
- Statistical test results (Mann-Whitney U, effect sizes)
- Summary comparison table
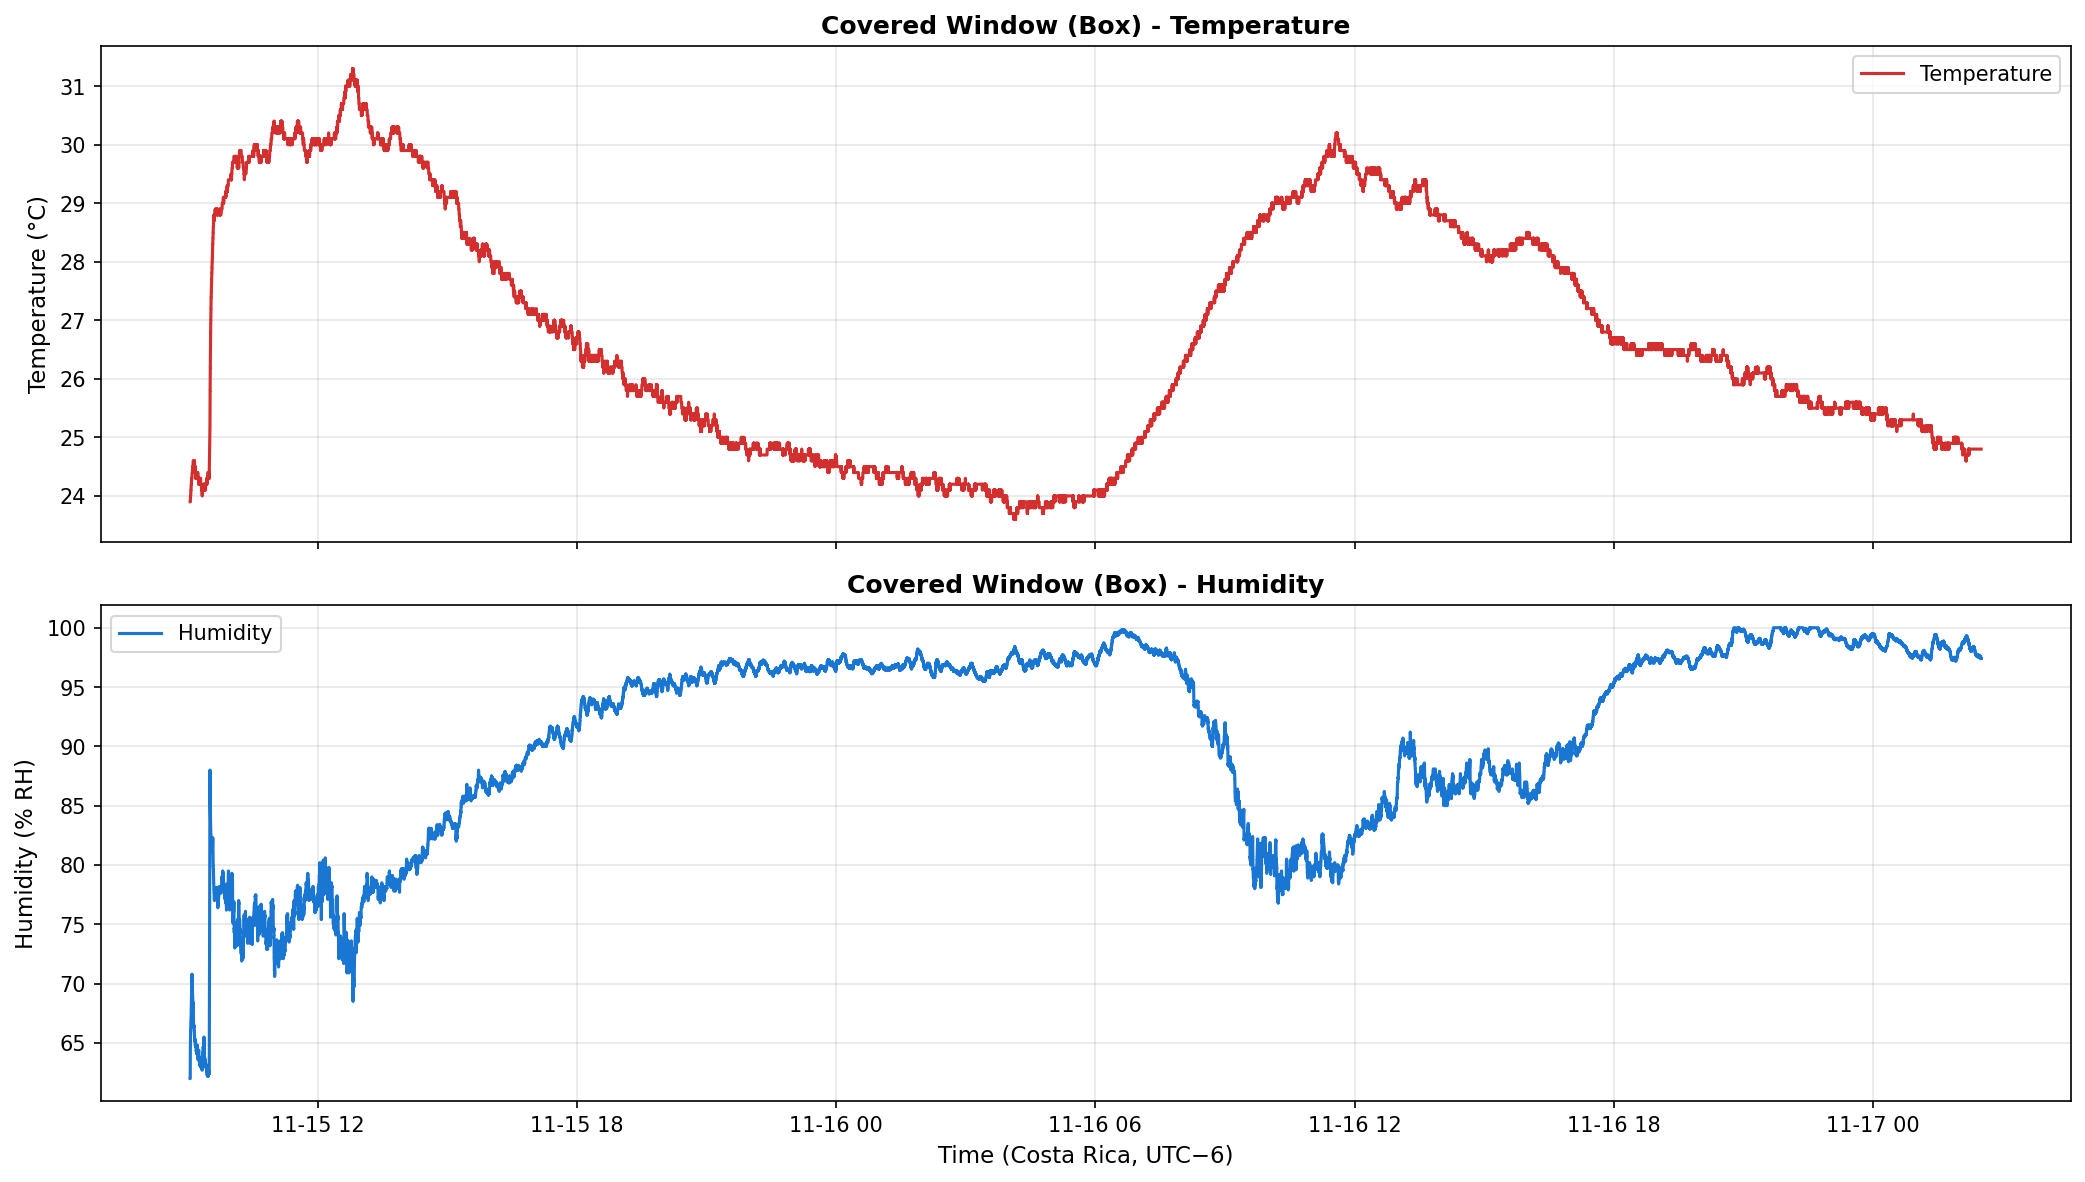
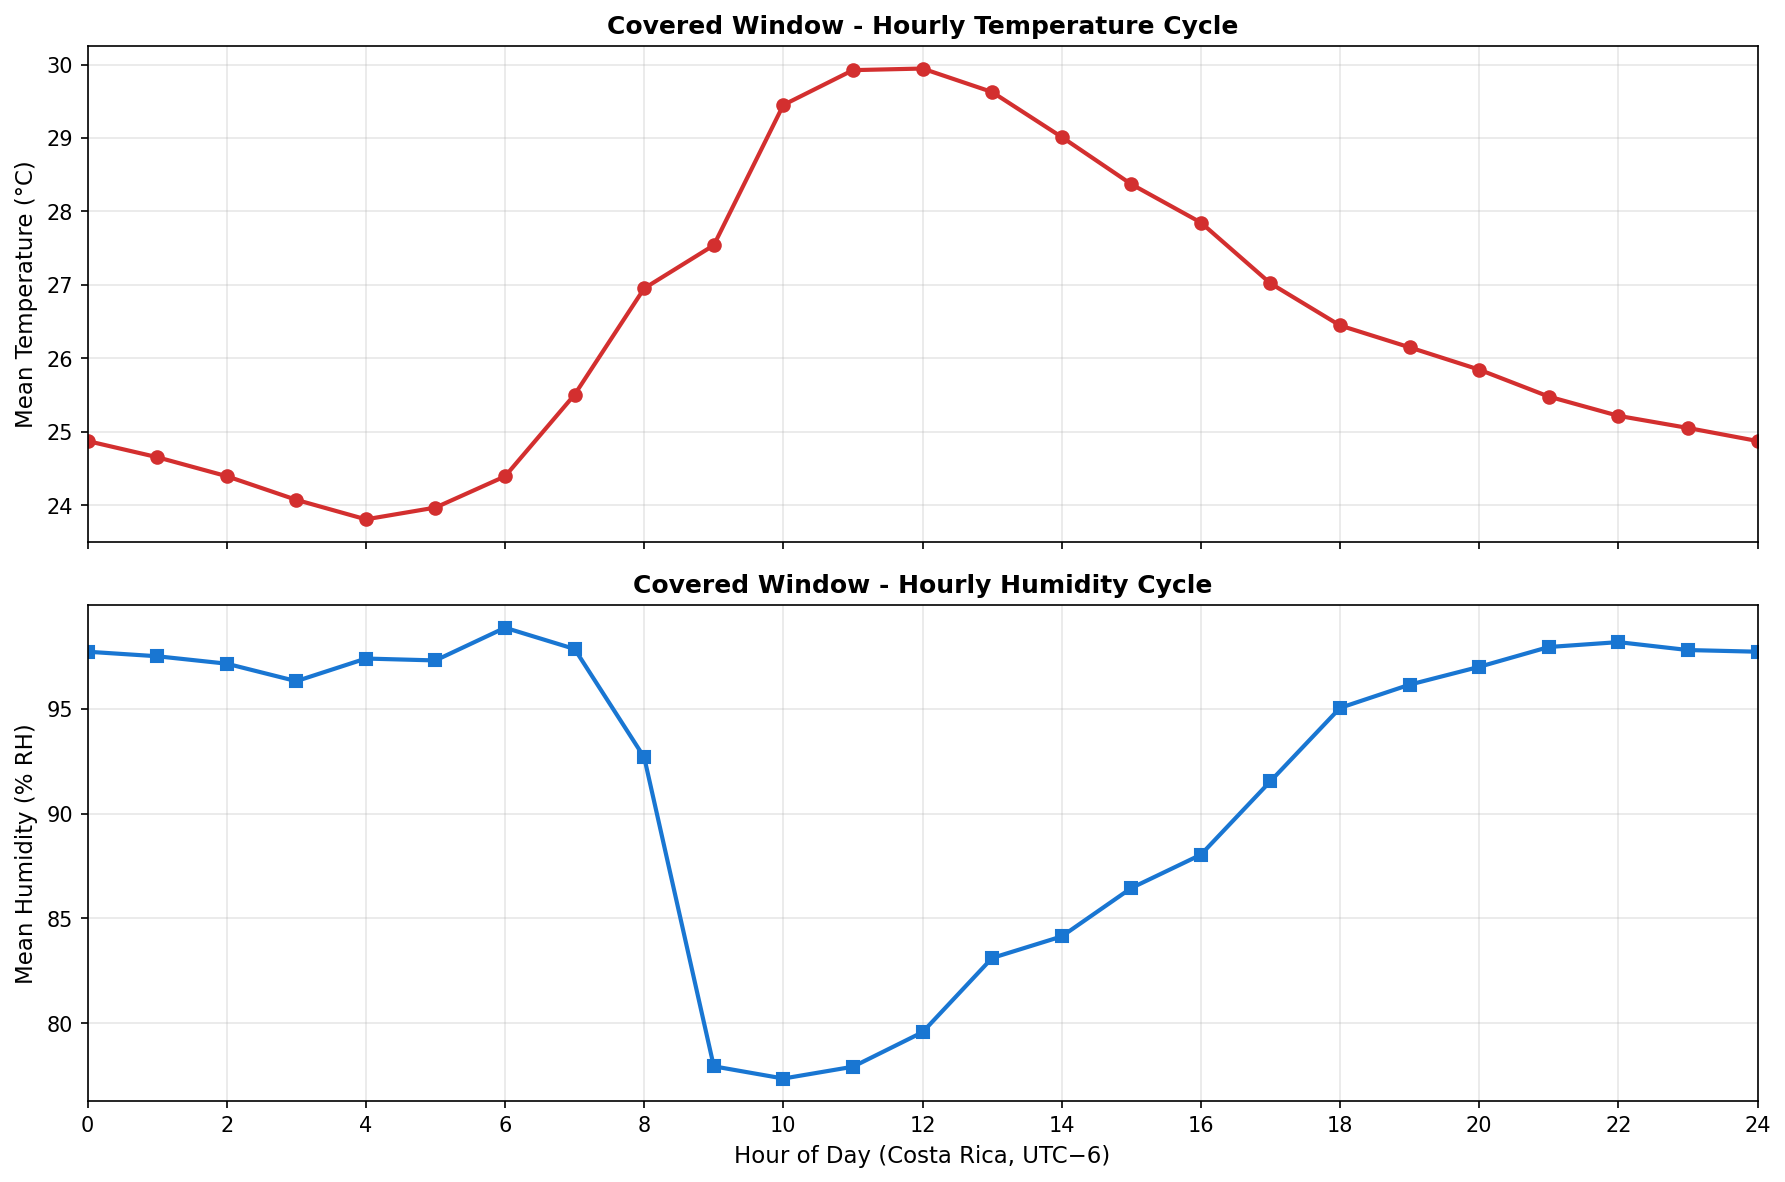
Environmental Conditions Analysis (DHT Data)
Temperature and humidity data from the dedicated DHT sensor (esp-dht.local) placed inside the cardboard box provides insight into environmental conditions during the covered and post-removal periods.
DHT Data Coverage
- Covered Window: 139,161 readings (temp_primary and hum_primary)
- Post-Removal Window: 537,826 readings (temp_primary and hum_primary)
- Uncovered Window: No DHT data (sensor was not active during baseline period)
Temperature and Humidity Patterns
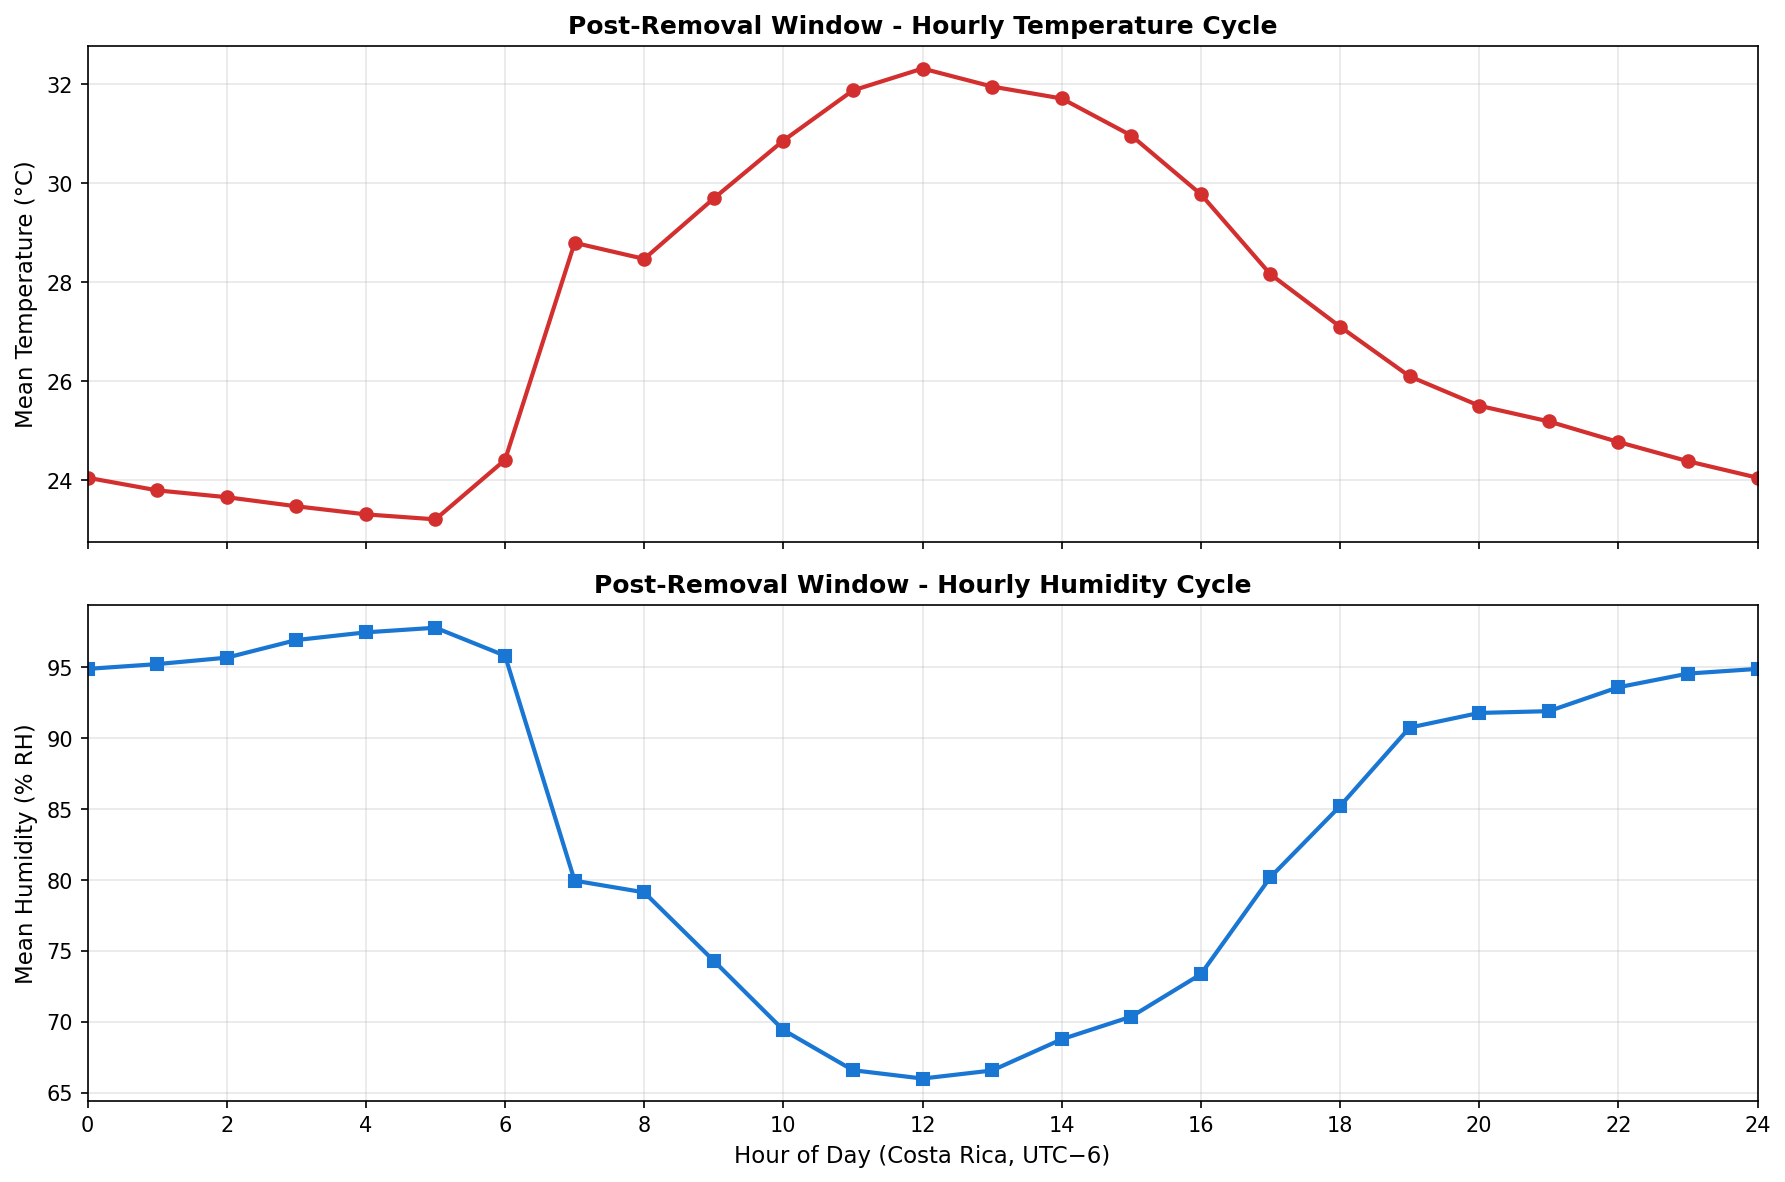
Correlation Analysis: DHT vs Electrical Signals
To assess whether environmental changes (temperature/humidity) explain the electrical signal changes, we computed Pearson correlation coefficients between DHT data and electrical activity for each cluster:
| Condition | Cluster | Temperature Correlation | Humidity Correlation |
|---|---|---|---|
| Covered | Cluster A (Northern Arc) | +0.31 (p < 0.0001) | -0.25 (p < 0.0001) |
| Covered | Cluster B (Western Block) | -0.05 (p = 0.18) | +0.28 (p < 0.0001) |
| Post-Removal | Cluster A (Northern Arc) | +0.50 (p < 0.0001) | -0.49 (p < 0.0001) |
| Post-Removal | Cluster B (Western Block) | -0.18 (p < 0.0001) | +0.25 (p < 0.0001) |
Interpretation
Key Findings:
- Cluster A shows moderate-to-strong correlations with temperature (+0.31 covered, +0.50 post-removal) and humidity (-0.25 covered, -0.49 post-removal), suggesting environmental factors may contribute to electrical activity changes in this cluster.
- Cluster B shows weak correlations with temperature (not significant in covered period, -0.18 post-removal) but moderate correlations with humidity (+0.28 covered, +0.25 post-removal).
- Environmental factors alone do not fully explain the dramatic Cluster B response (+52.8% increase), as temperature correlations are weak or negative. The humidity correlation (+0.28) is moderate but cannot account for the magnitude of change.
- State-dependent responses persist: Even with environmental correlations, the differential response between clusters suggests that baseline electrical state plays a primary role in determining how darkness/environmental changes affect the network.
Conclusion: While environmental conditions (temperature, humidity) show correlations with electrical activity, particularly for Cluster A, they cannot fully explain the state-dependent darkness effects. The dramatic Cluster B response (+52.8%) appears to be primarily driven by the electrical state of the network at the time of intervention, with environmental factors playing a secondary role.
Discussion & Conclusions
Primary Findings
1. Darkness produces state-dependent responses. The quantitative analysis reveals that darkness has dramatically different effects on the two spatial clusters:
- Cluster B shows a massive +52.8% increase in mean electrical activity
- Cluster A shows only a -1.6% decrease
- This suggests the clusters were in different electrical states when darkness was applied
2. Diurnal rhythms persist across all conditions. The patterns persist under cardboard box coverage and after removal, suggesting that:
- The circadian rhythm is not purely light-driven
- Internal biological clocks or other environmental cues (temperature, humidity cycles) may maintain the rhythm
- The electrical patterns are robust to light deprivation and recovery
- The diurnal waveform shape is maintained even when absolute activity levels change
3. Recovery patterns differ by cluster. Post-removal analysis reveals:
- Cluster B shows partial recovery (-9% from peak) but remains +39% above baseline, suggesting persistent effects
- Cluster A shows continued slight decline, indicating the change may be independent of the darkness intervention
- Both clusters maintain diurnal patterns despite changes in absolute activity levels
4. Spatial clustering is maintained under all three conditions, reinforcing that the two groups (morning vs. evening peaks) represent stable biological states rather than measurement artifacts.
5. State-dependent responses may explain variability in stimulus experiments. The dramatic difference in response between clusters suggests that future experiments should consider baseline state when interpreting responses.
Primary Findings
1. Darkness alone does not eliminate diurnal electrical rhythms. The patterns persist under cardboard box coverage, suggesting that:
- The circadian rhythm is not purely light-driven
- Internal biological clocks or other environmental cues (temperature, humidity cycles) may maintain the rhythm
- The electrical patterns are robust to light deprivation
2. Spatial clustering is maintained under both conditions, reinforcing that the two groups (morning vs. evening peaks) represent stable biological states rather than measurement artifacts.
3. The experiment design was sound for testing darkness effects, but the missing DHT data prevents us from fully understanding the environmental changes inside the box.
Implications for Faraday Cage Implementation
Darkness is not a confounding factor. Since darkness alone doesn't eliminate the patterns, we can proceed with Faraday cage implementation knowing that any changes observed will be due to electromagnetic shielding, not darkness.
Environmental monitoring is critical. Future experiments should ensure DHT data is recorded to correlate environmental changes with electrical signals.
Baseline comparison is valid. The uncovered window provides a good baseline for comparison, though simultaneous controls would be ideal.
Limitations
- DHT Data Missing: Temperature and humidity data were not recorded, preventing correlation analysis. The box likely created a different microclimate that could affect electrical signals.
- Time Gap: ~1.5 day gap between windows prevents direct comparison of the same time periods.
- Different Durations: Uncovered window (~6 days) vs covered window (~4 days) limits direct statistical comparison.
- No Simultaneous Control: We don't have an uncovered control during the covered period, so we're comparing different time periods rather than true experimental conditions.
Recommendations
- Proceed with Faraday cage: The darkness test suggests we can implement the Faraday cage without concern that darkness alone will mask electromagnetic effects.
- Ensure DHT recording: Verify DHT sensors are functioning and recording data in future experiments.
- Consider simultaneous controls: If possible, run uncovered and covered conditions simultaneously using multiple blocks to control for temporal variation.
- Extended analysis: Compare hourly cycle amplitudes, analyze power spectra differences, look for phase shifts in peak timing, and perform statistical comparison of mean values per hour.
Reproducibility & Data Accessibility
- Raw CSVs:
analysis/fungal_state_mapping/outputs/experiment_003_darkness/CSV/uncovered/andanalysis/fungal_state_mapping/outputs/experiment_003_darkness/CSV/covered/ - Extraction script:
analysis/fungal_state_mapping/scripts/extract_experiment_003_range.py - Plot generation:
analysis/fungal_state_mapping/scripts/generate_experiment_003_plots.py - Quantitative analysis:
analysis/fungal_state_mapping/scripts/quantify_experiment_003_darkness_effects.py - DHT correlation script:
analysis/fungal_state_mapping/scripts/analyze_experiment_003_dht_correlation.py(ready but not used due to missing DHT data) - Derived data:
analysis/fungal_state_mapping/outputs/experiment_003_darkness/derived/ - Quantitative tables:
analysis/fungal_state_mapping/outputs/experiment_003_darkness/quantitative/ - Quantitative HTML:
experiments/experiment-003-darkness/quantitative_comparison.html