Overview
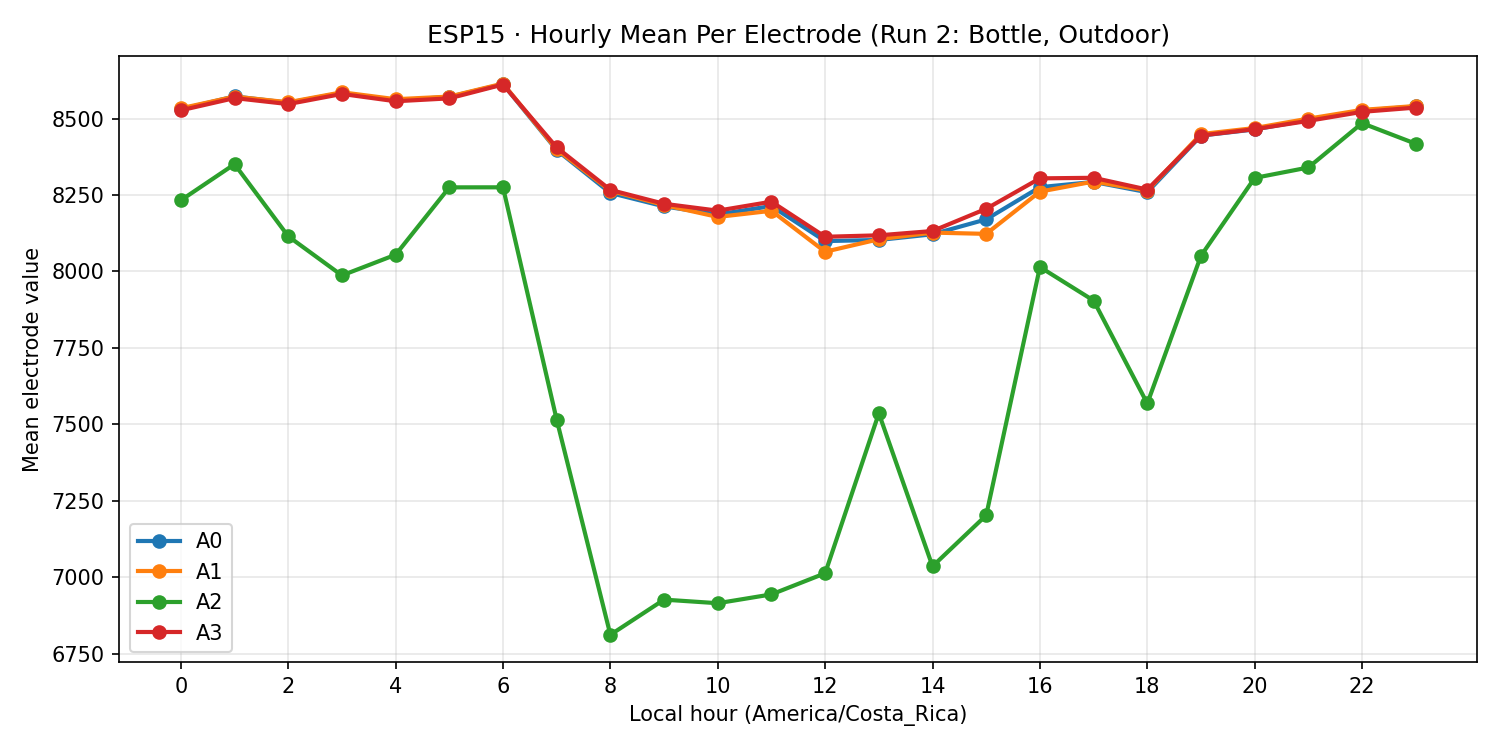
Motivation. This analysis addresses two key questions: (1) Do electrodes track together in a single connected substrate? (2) Do temperature fluctuations in outdoor environments cause the diurnal variations observed in saline controls? We extended the per-electrode analysis from Experiment 001B to Experiment 003's three runs. The hypothesis: one pool of saline should resemble one block of fungus—both represent potentially connected substrates where all electrodes sample the same electrical domain. Additionally, comparing outdoor (Run 2) vs temperature-controlled indoor (Run 3) conditions tests whether ambient temperature fluctuations and evaporation drive the "noon dip" patterns seen in previous saline controls.
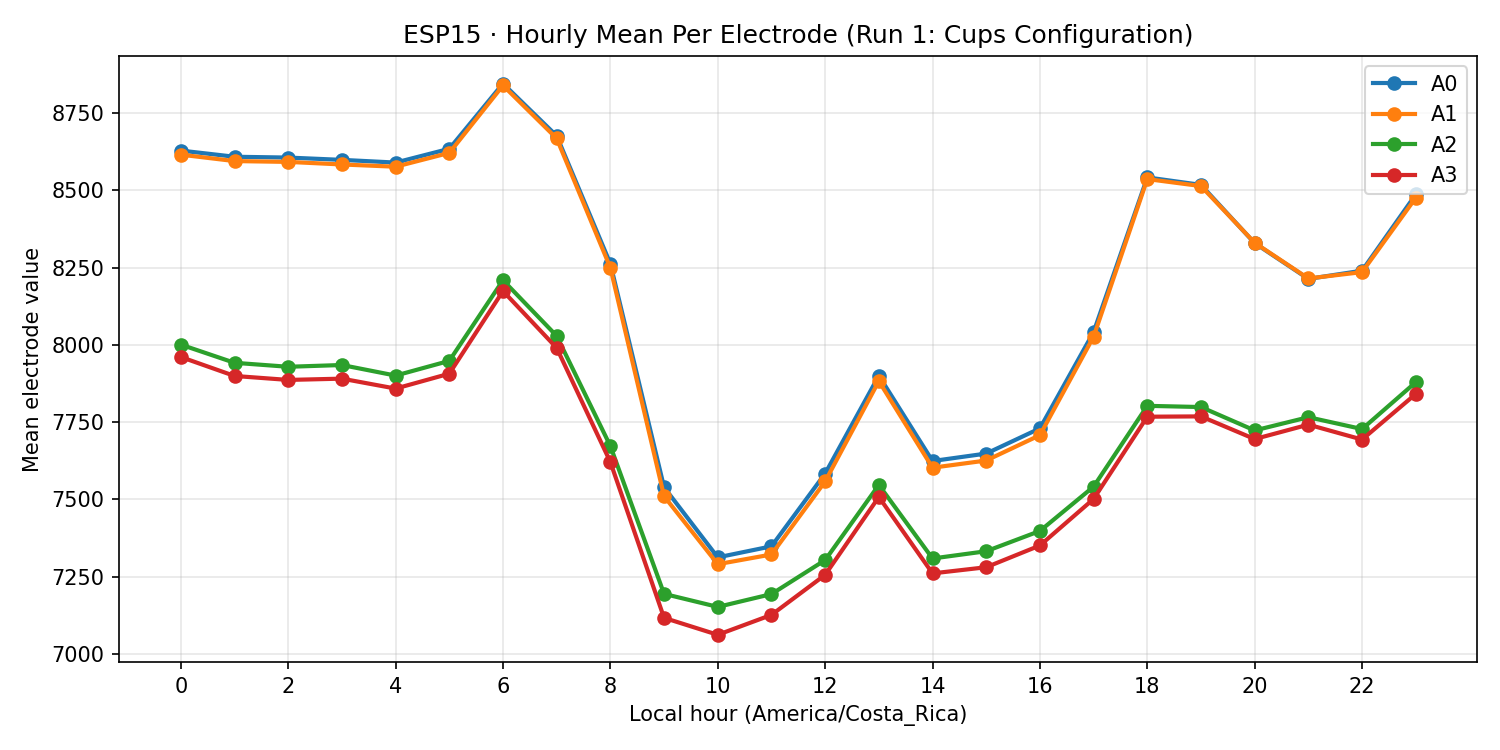
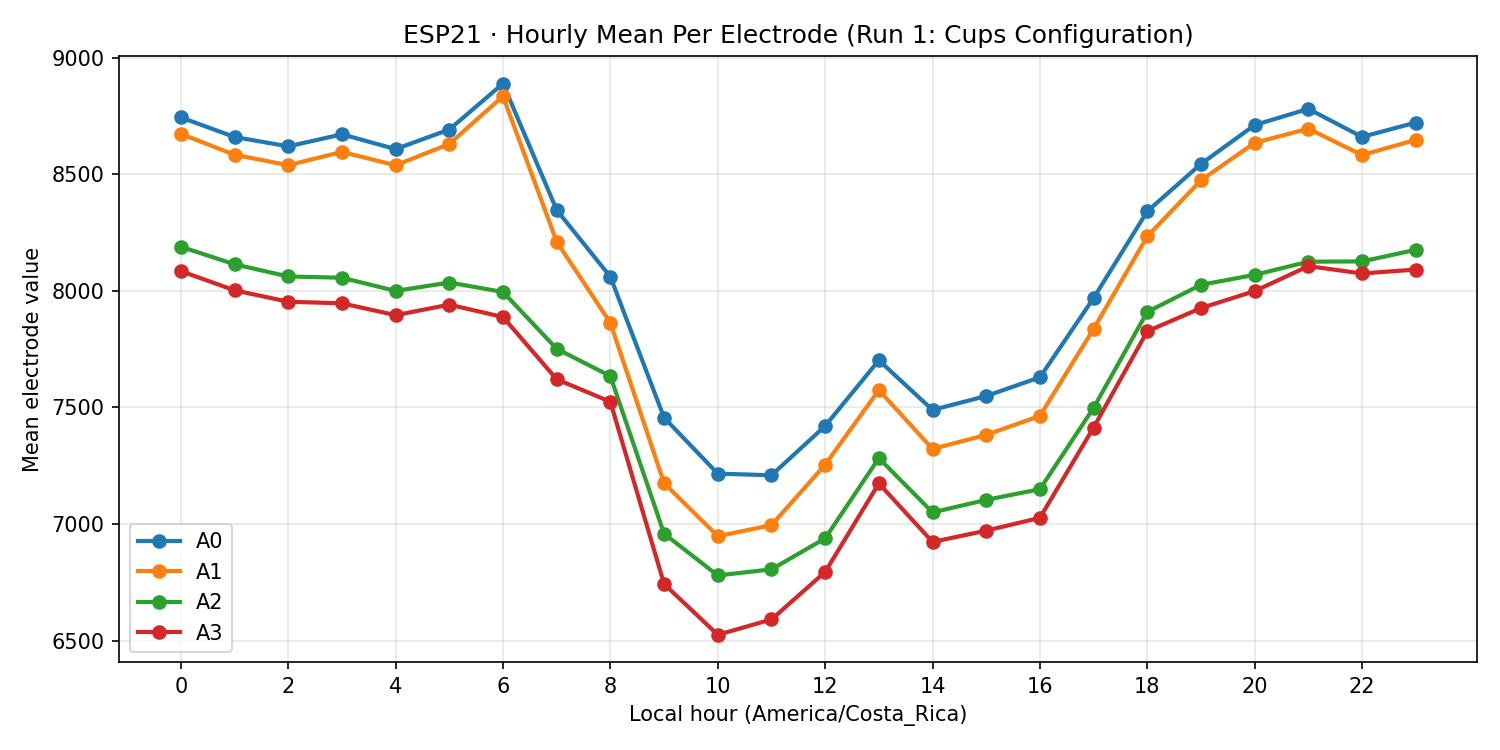
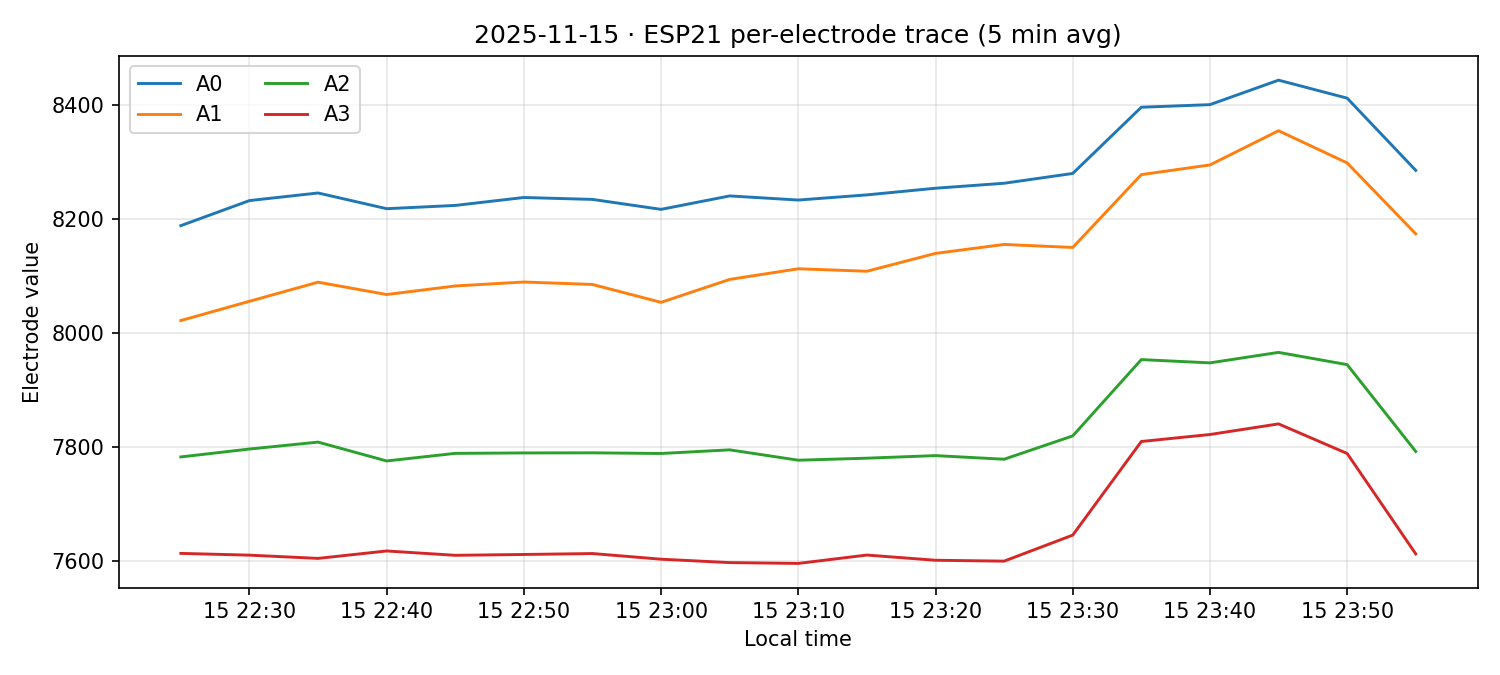
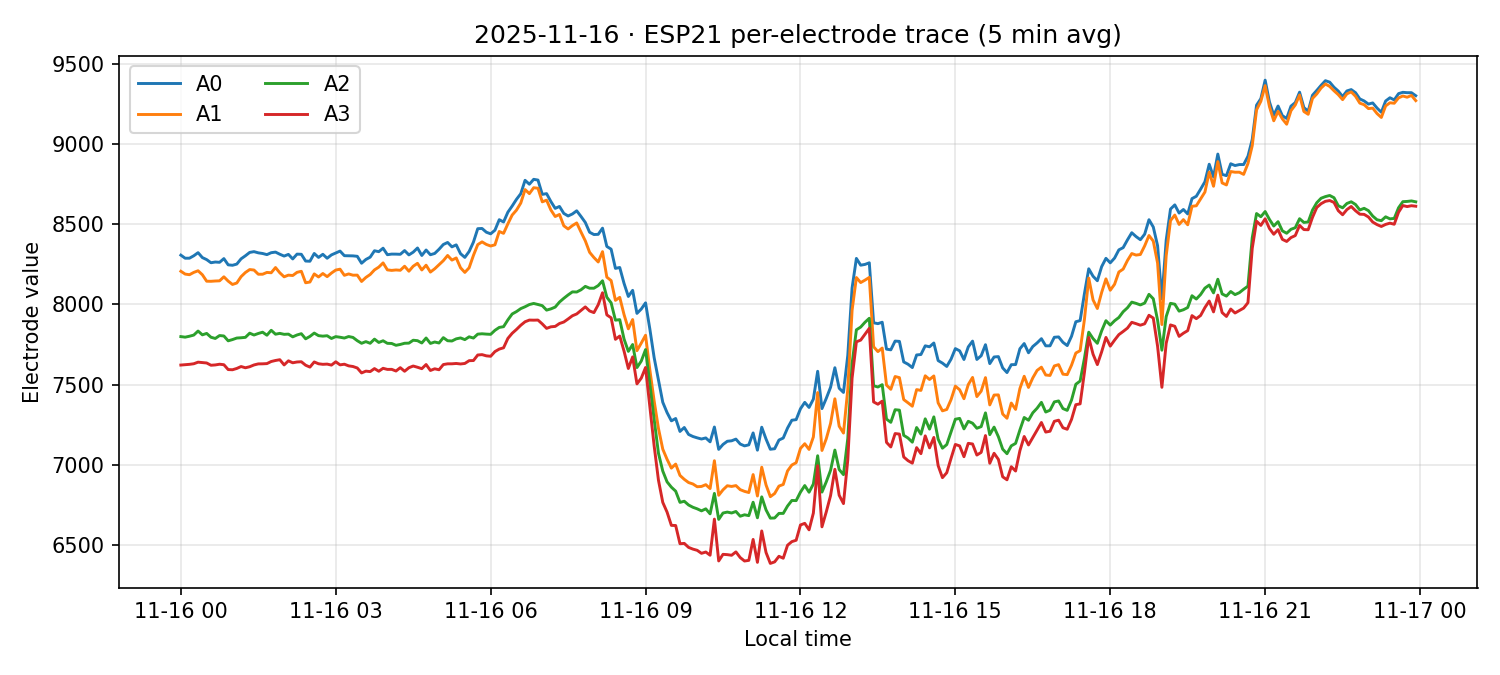
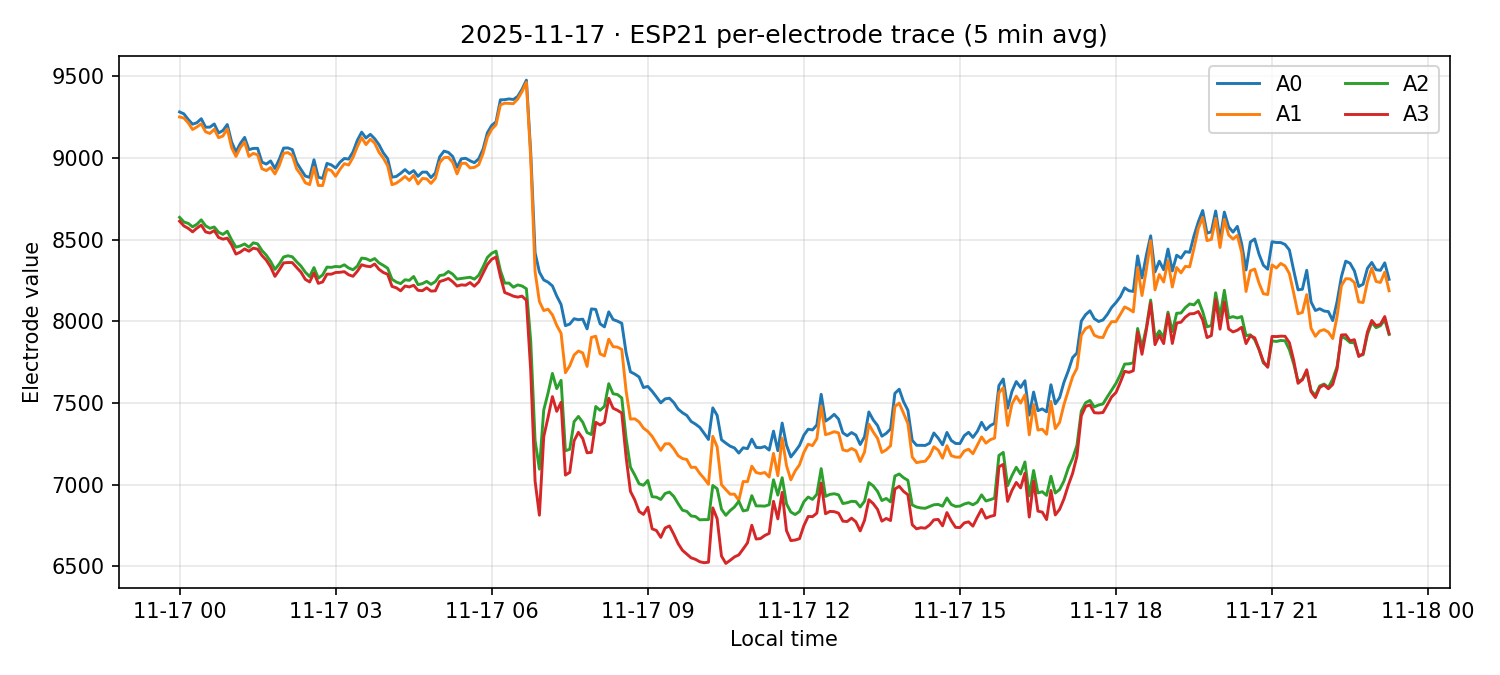
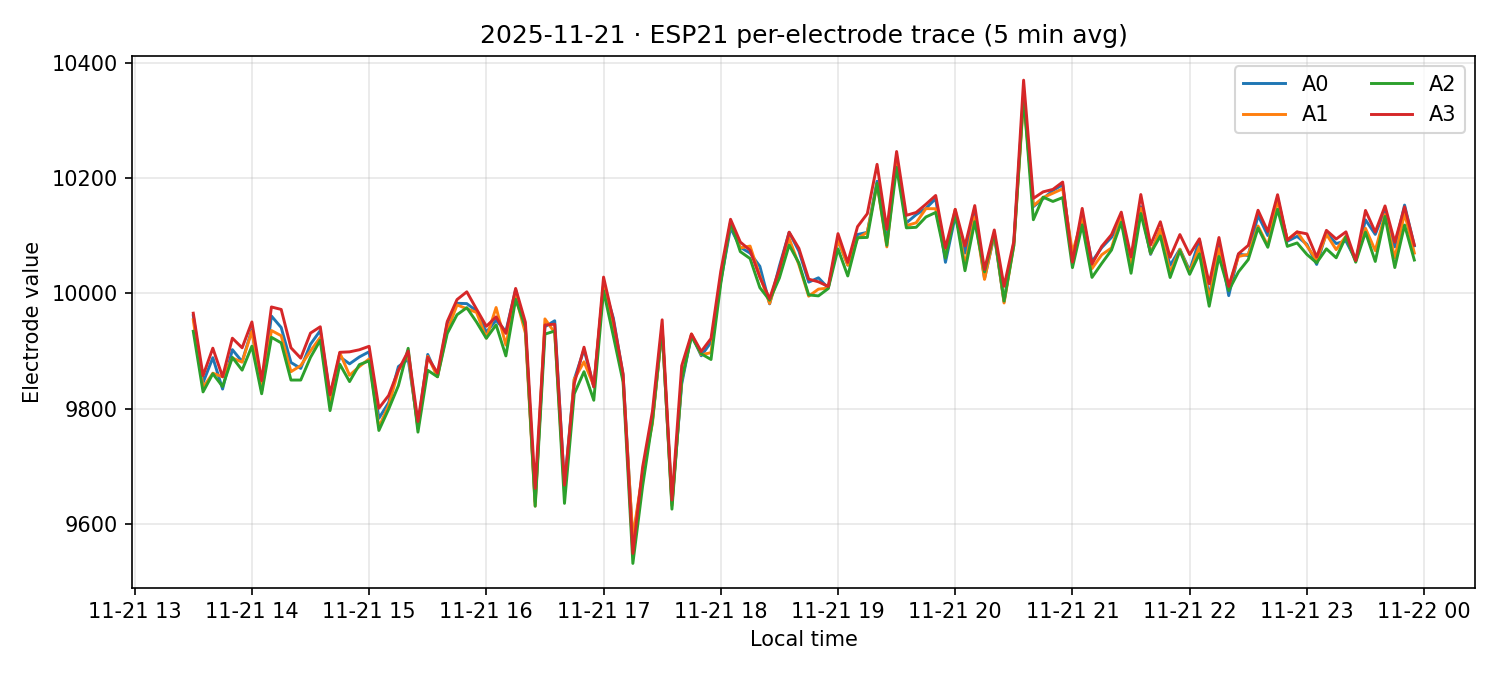
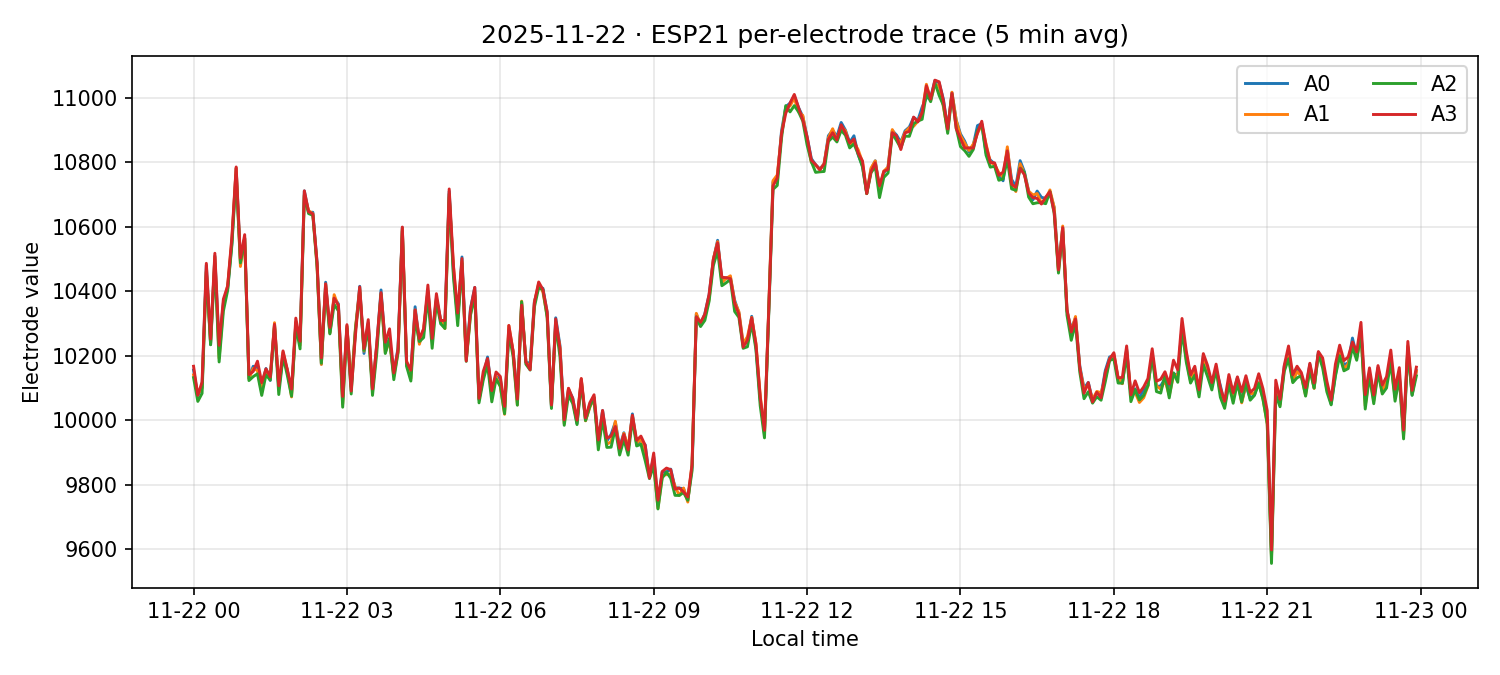
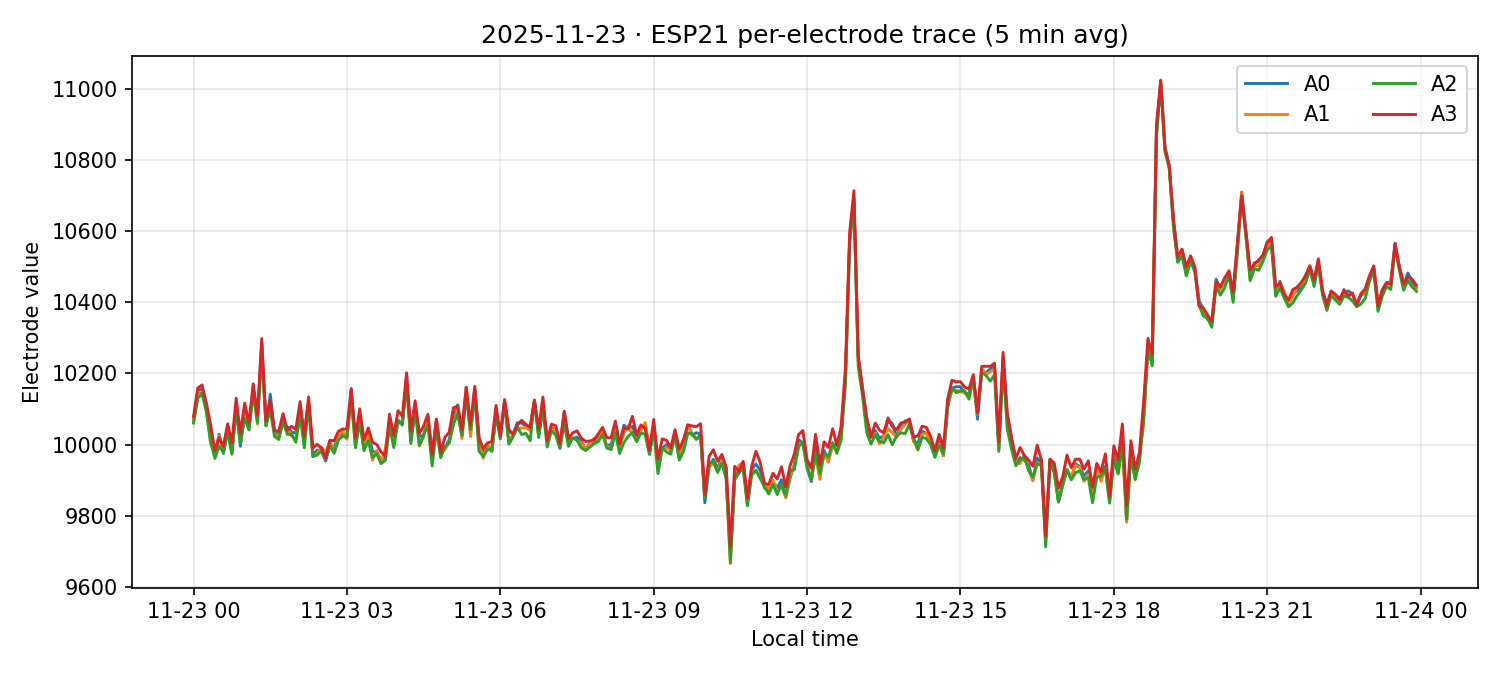
Approach. For each run, we resample each electrode (a0–a3) at 5-minute intervals, plot per-day traces, and examine per-electrode patterns using the same methodology as Experiment 001B. ESPs analyzed: ESP06, ESP12, ESP15, ESP21.
Runs. Run 1: November 15-17, 2025 (cups configuration—electrodes in separate cups). Run 2: November 19-21, 2025 (bottle, outdoor—all electrodes in single pool, exposed to ambient temperature fluctuations). Run 3: November 21-26, 2025 (bottle, AC room—same single pool, temperature-controlled environment).
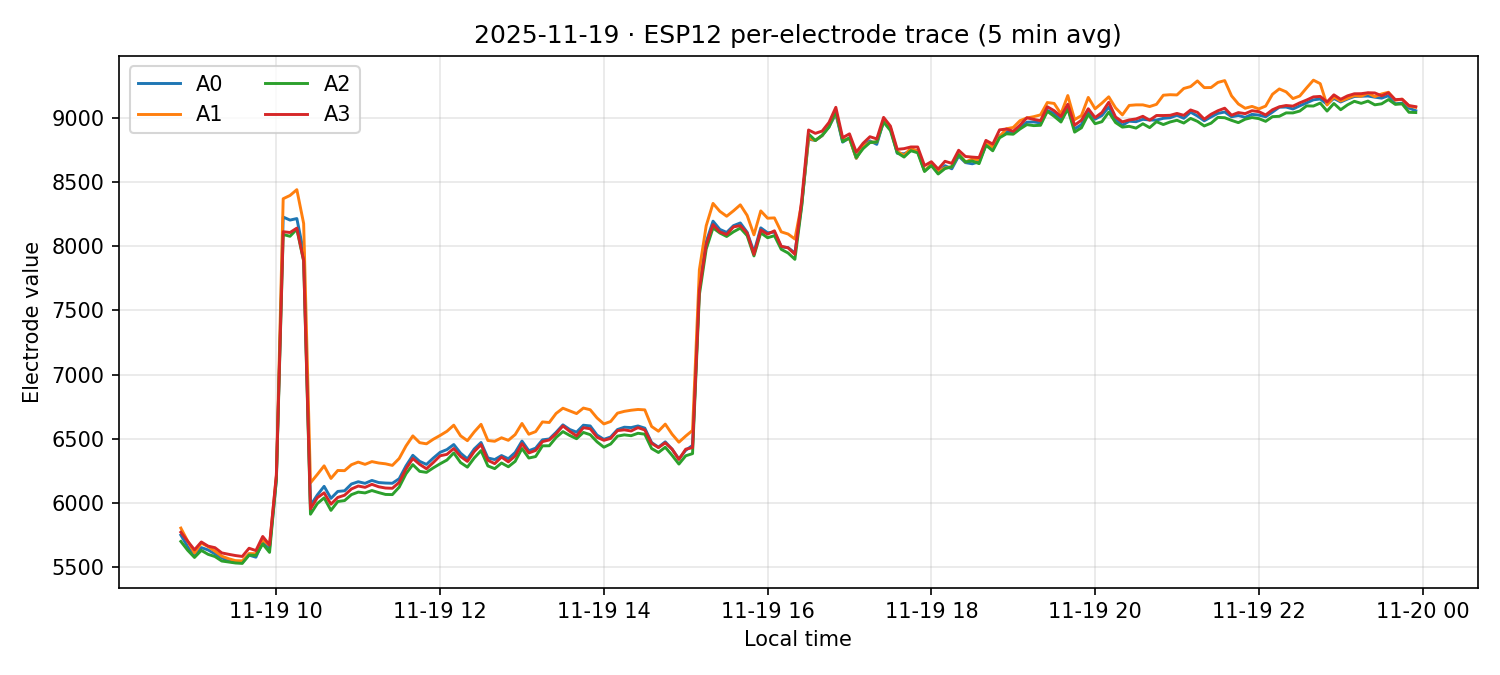
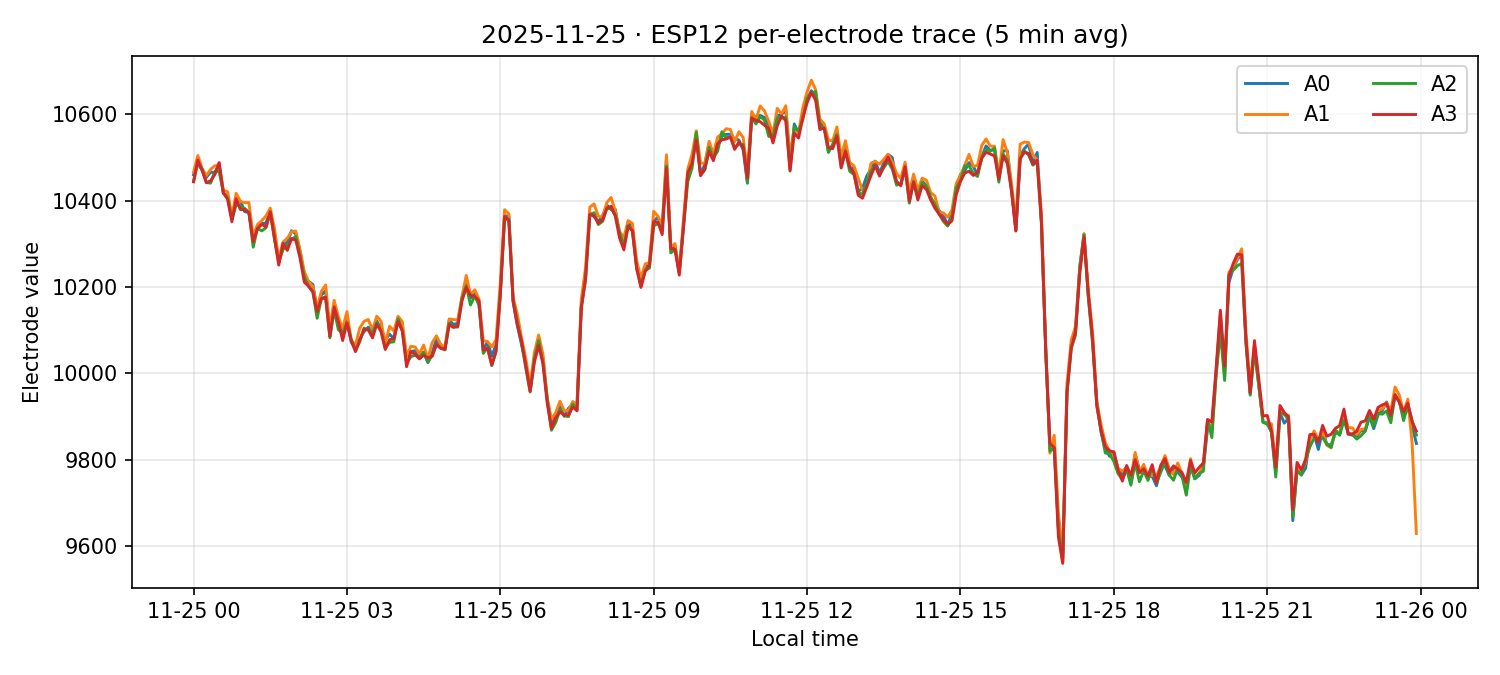
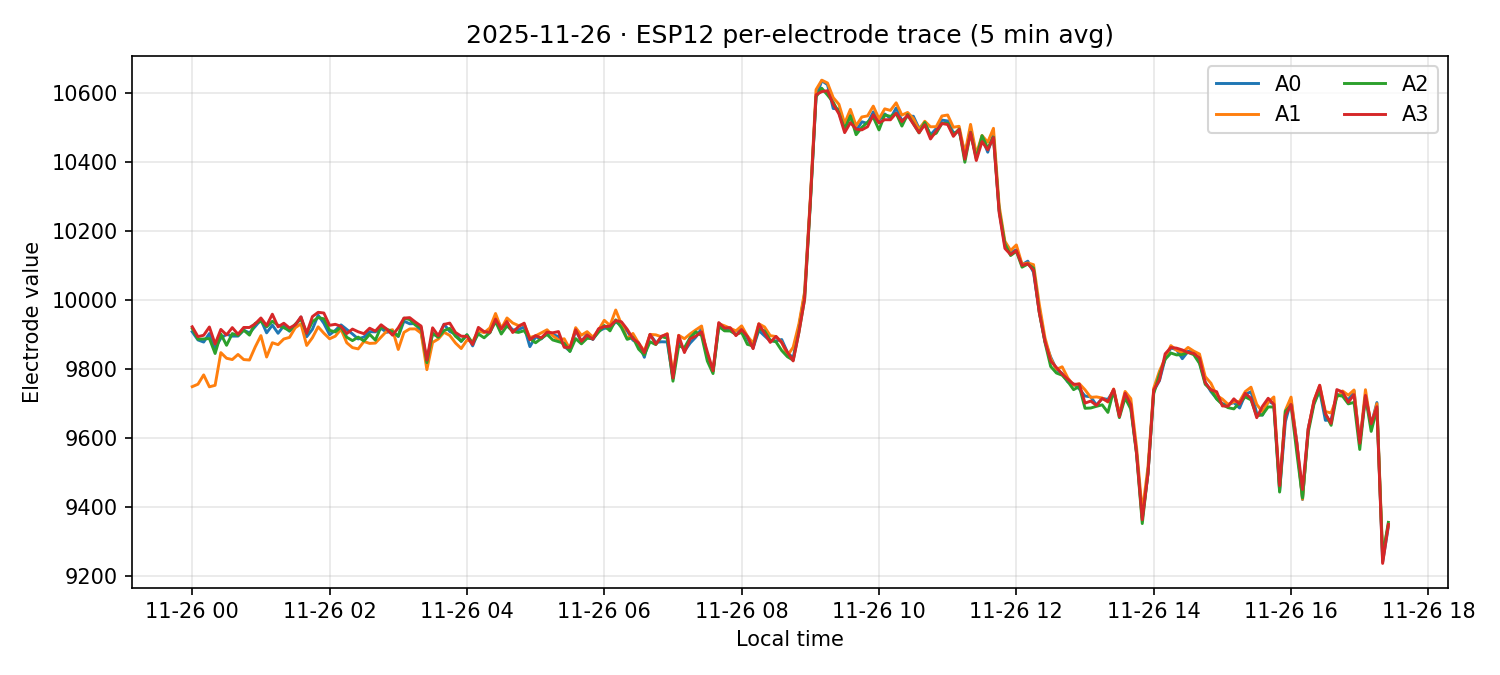
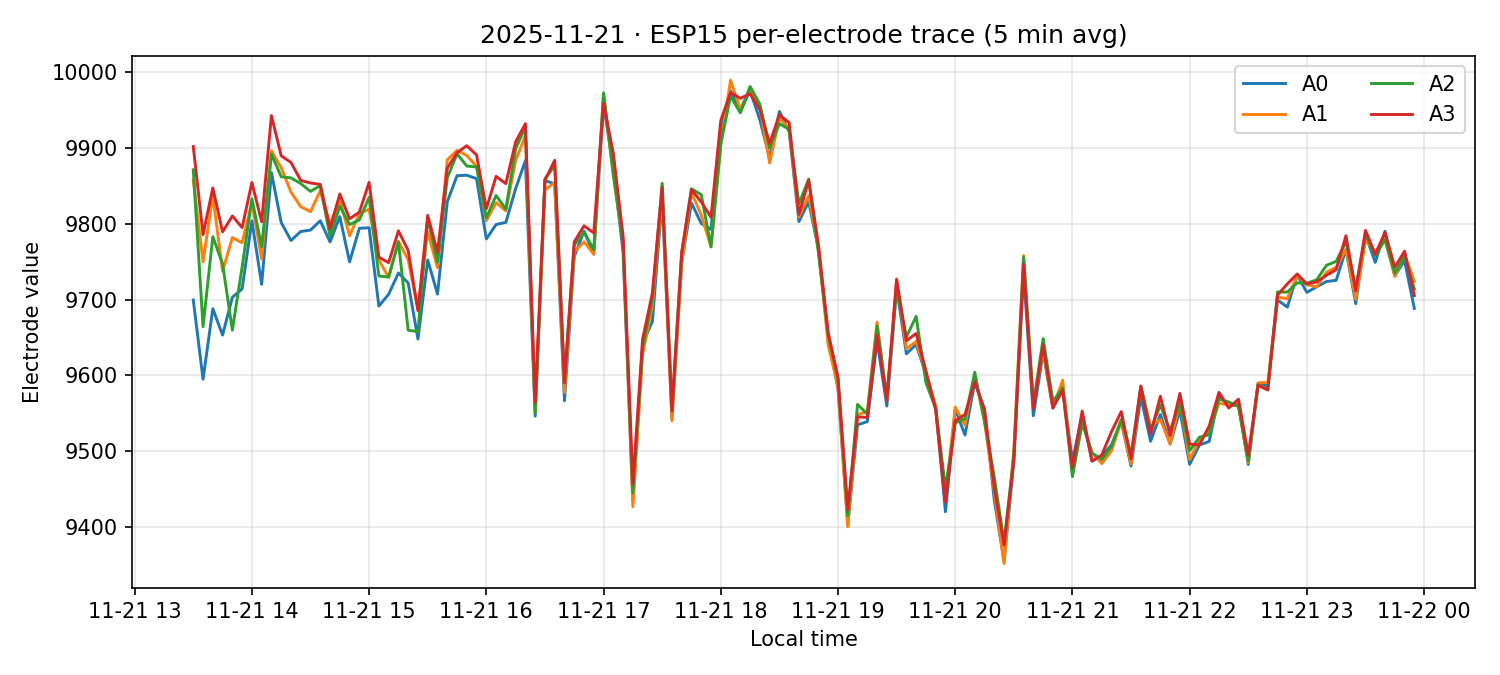
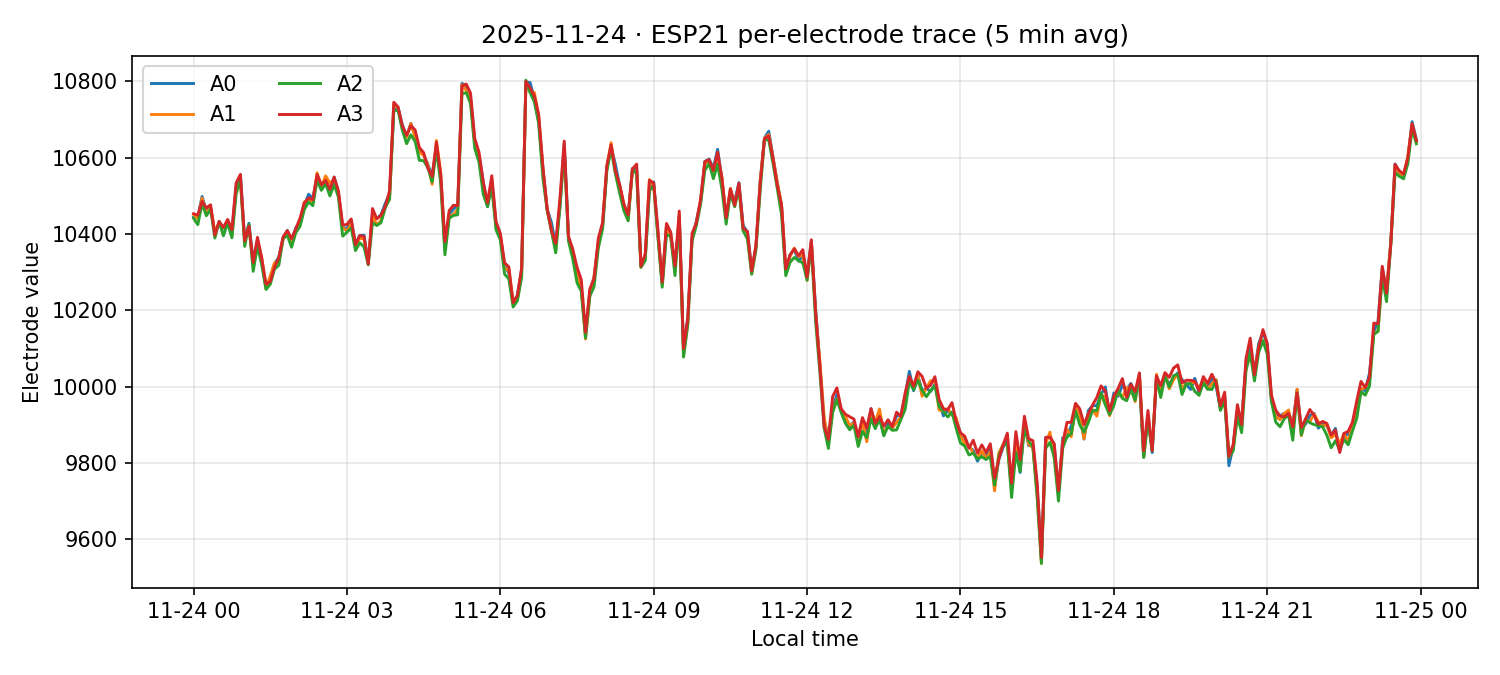
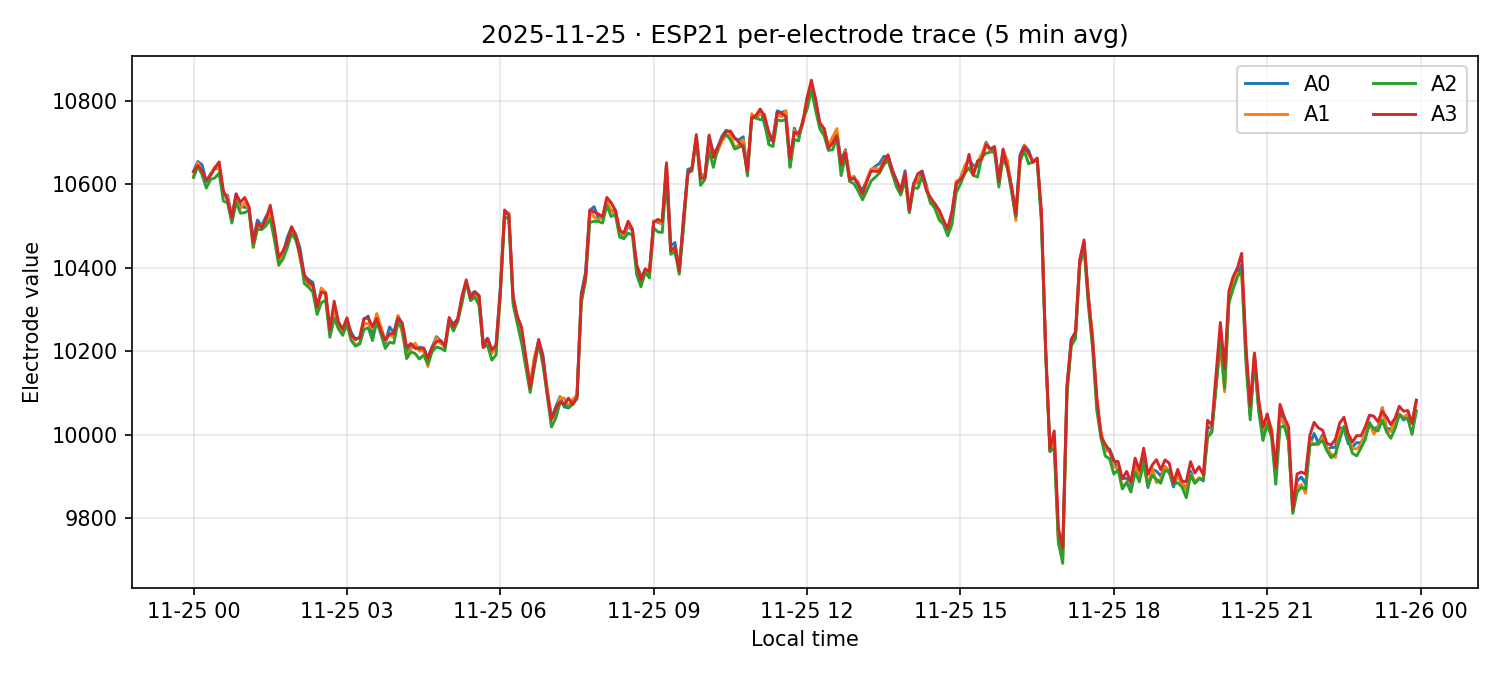
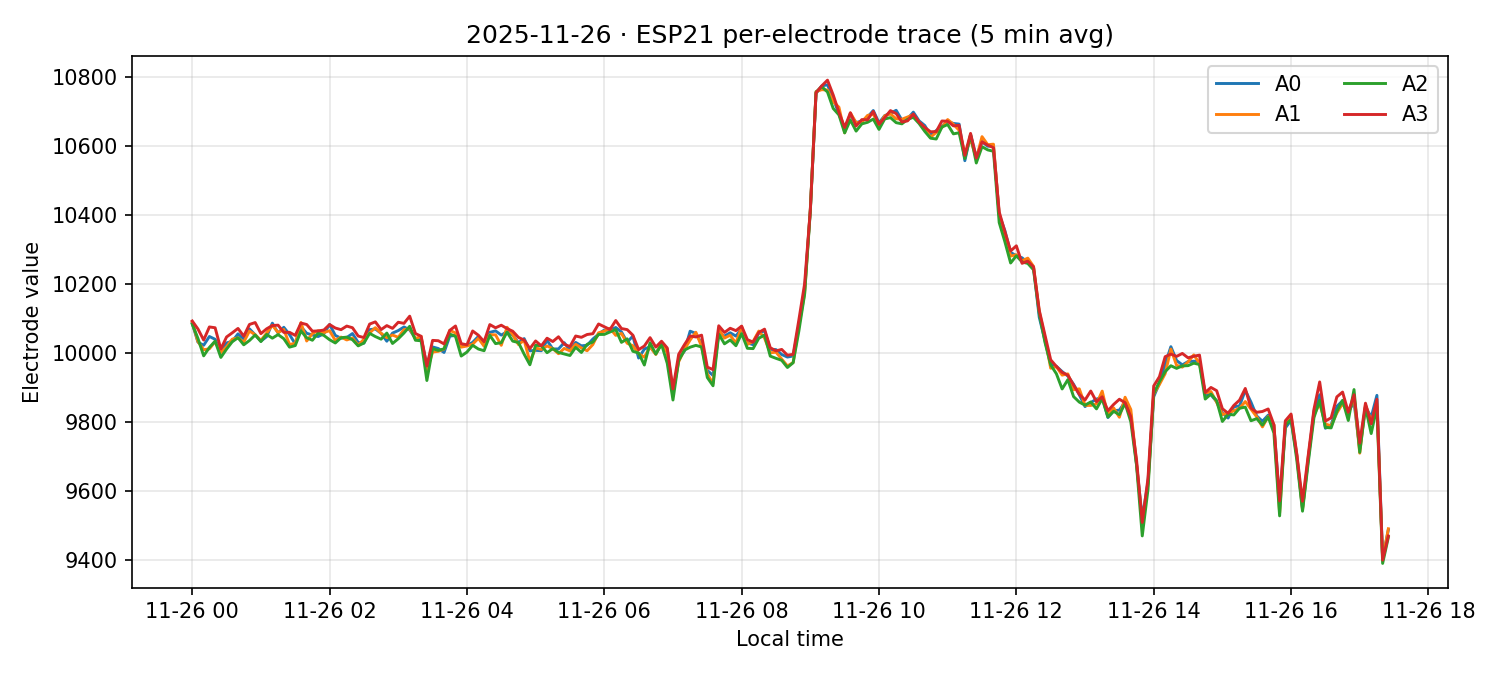
Results. Electrodes track together in the single-pool configurations (Runs 2 and 3), confirming that a connected substrate (whether saline or fungal) produces coherent electrode behavior. This supports the hypothesis that one pool of saline resembles one block of fungus in terms of electrical connectivity. Additionally, comparison of Run 2 (outdoor) vs Run 3 (AC room) demonstrates that temperature-controlled conditions dramatically reduce diurnal fluctuations, supporting the hypothesis that ambient temperature and evaporation drive the patterns observed in outdoor saline controls.
Use the panels below to switch between runs and ESPs, then scrub through the days with the slider.
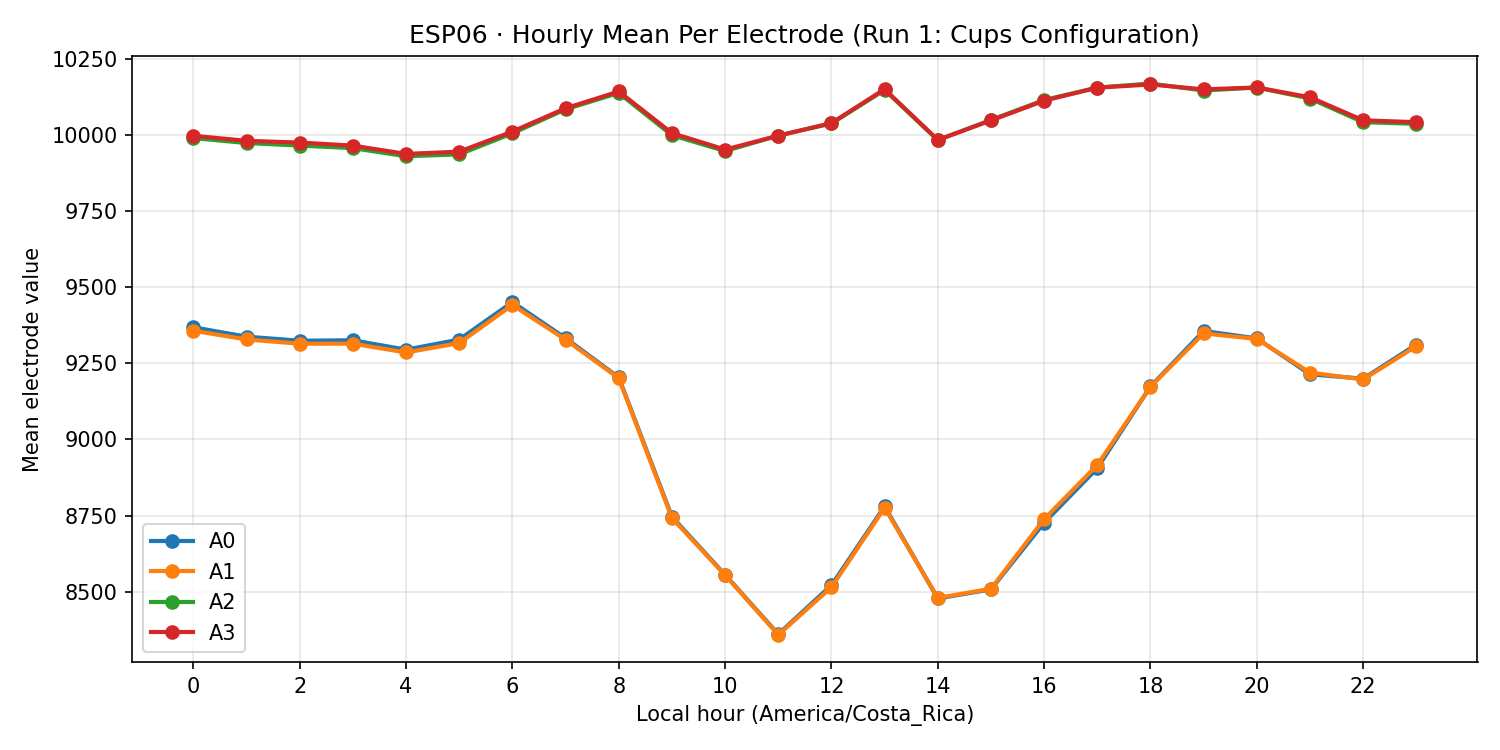
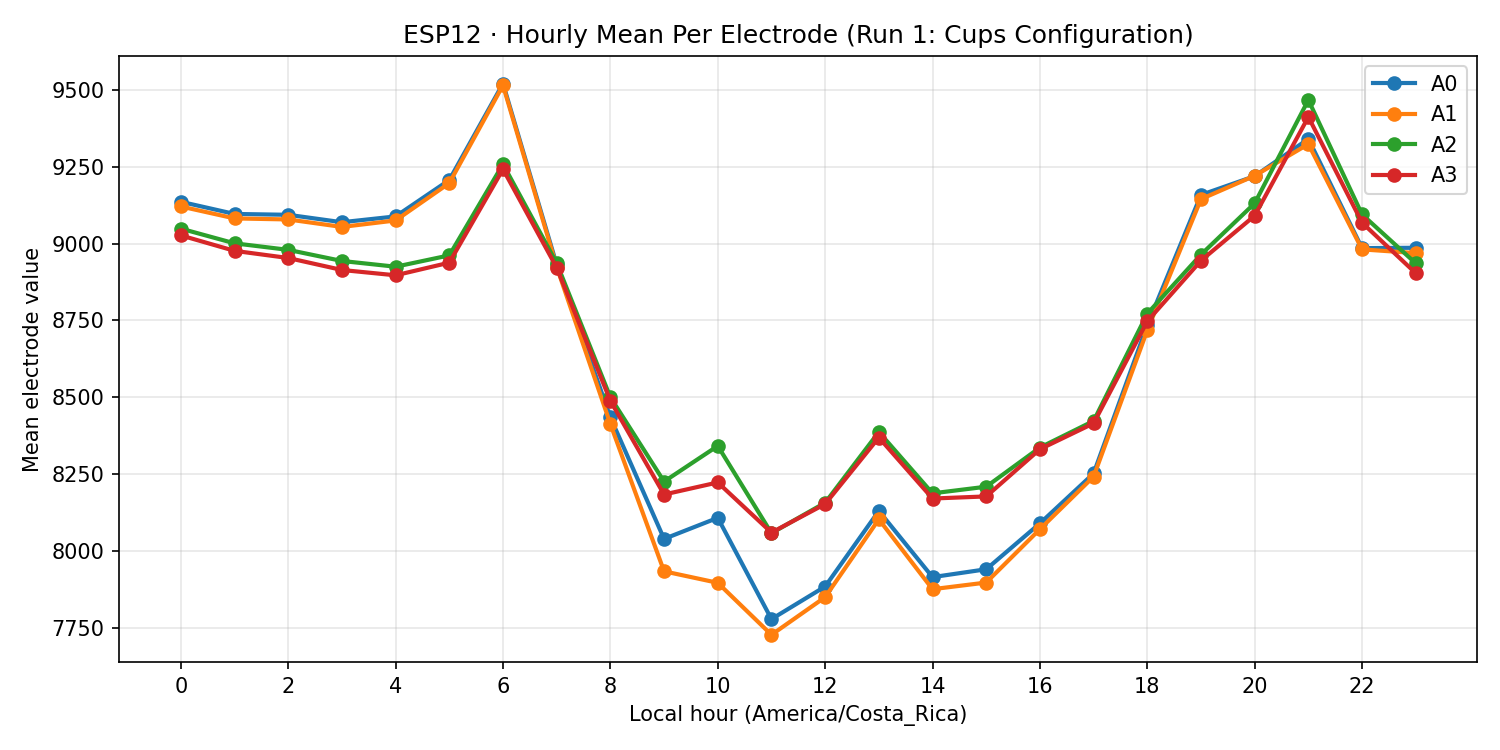
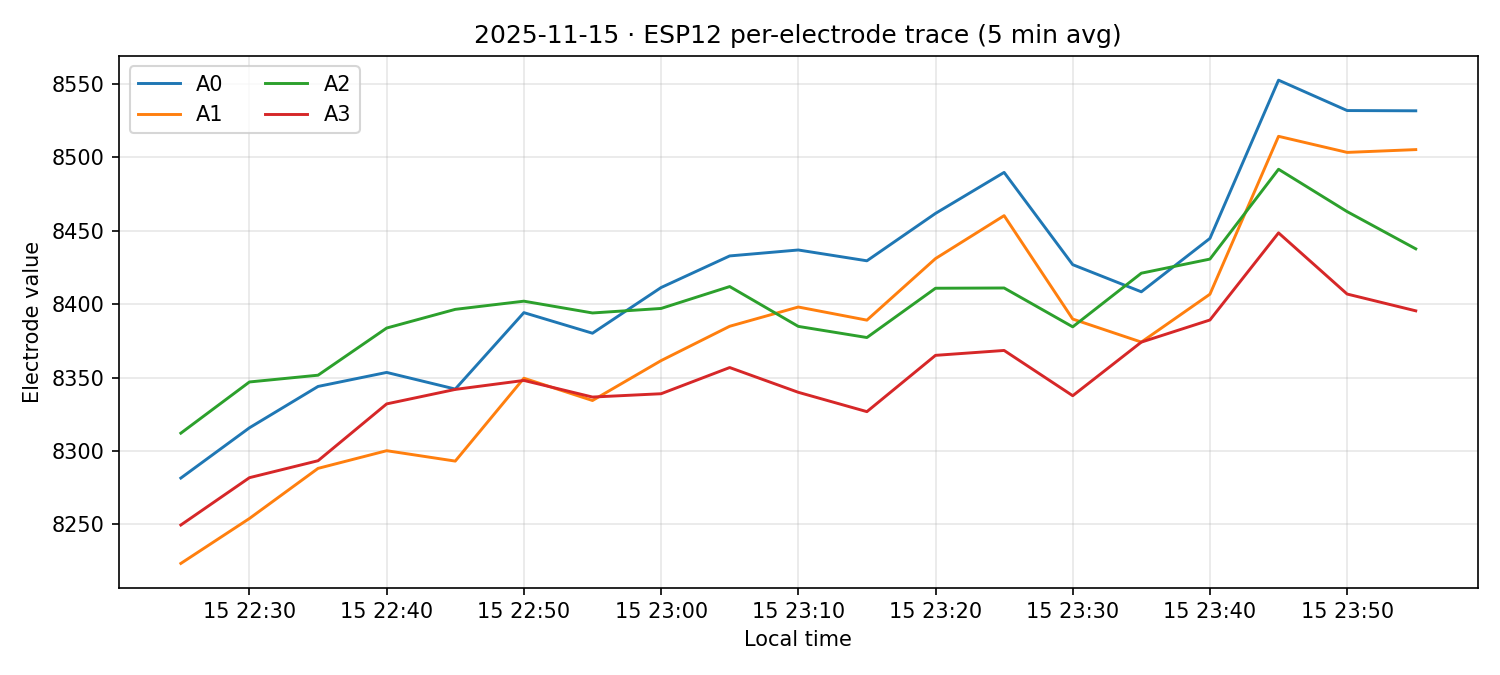
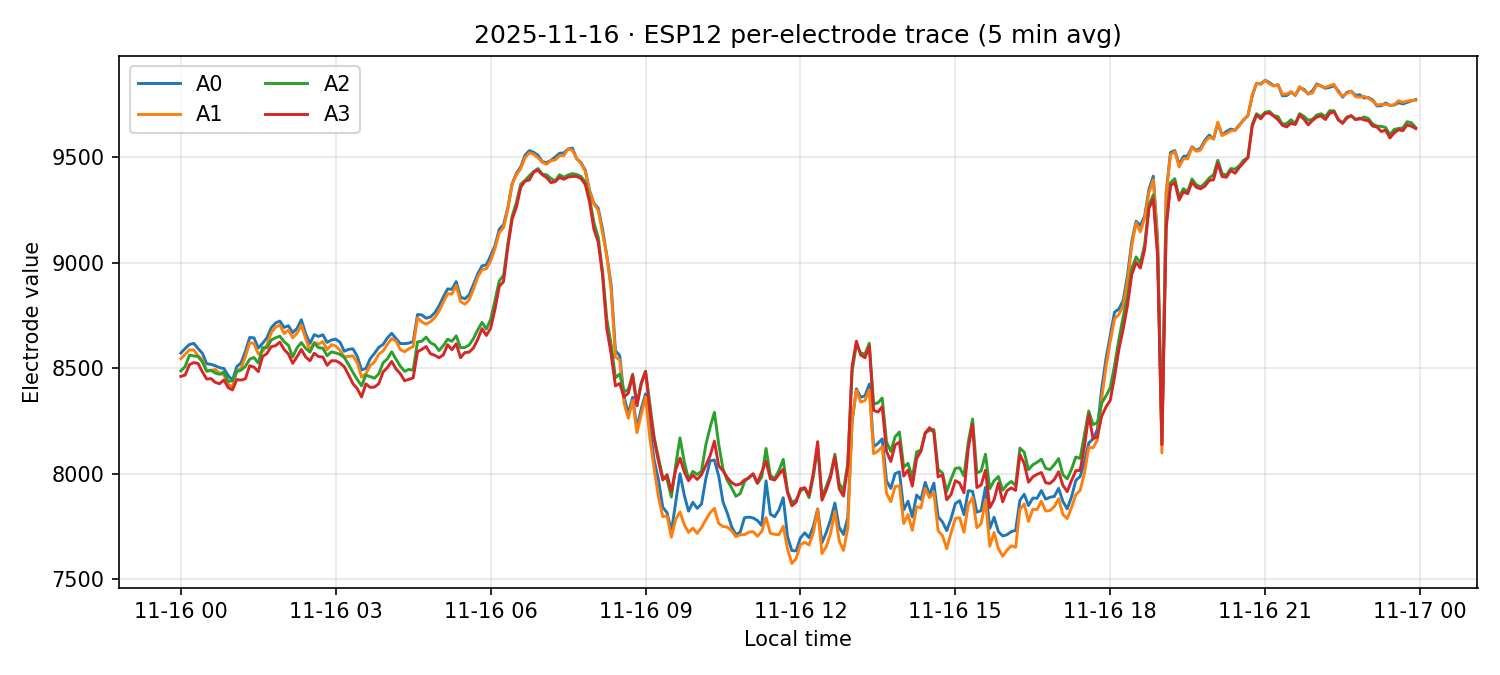
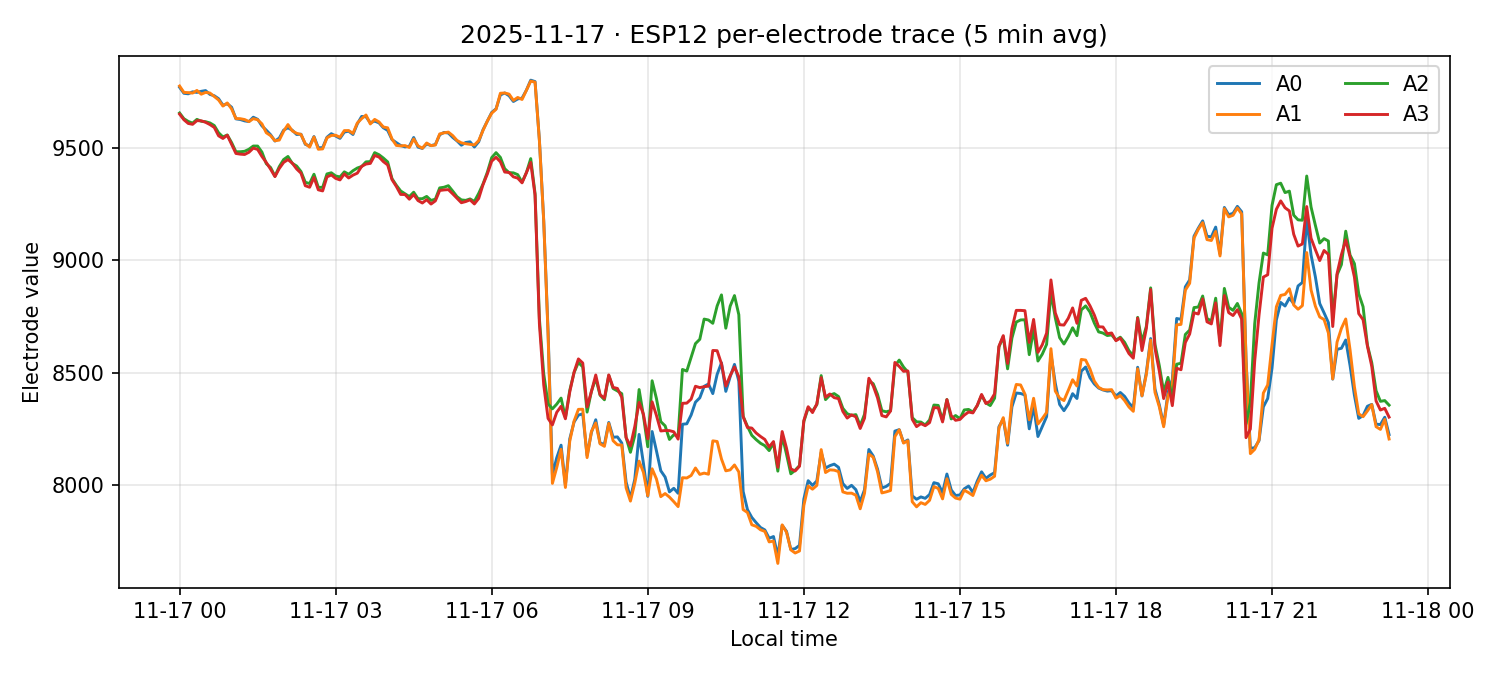
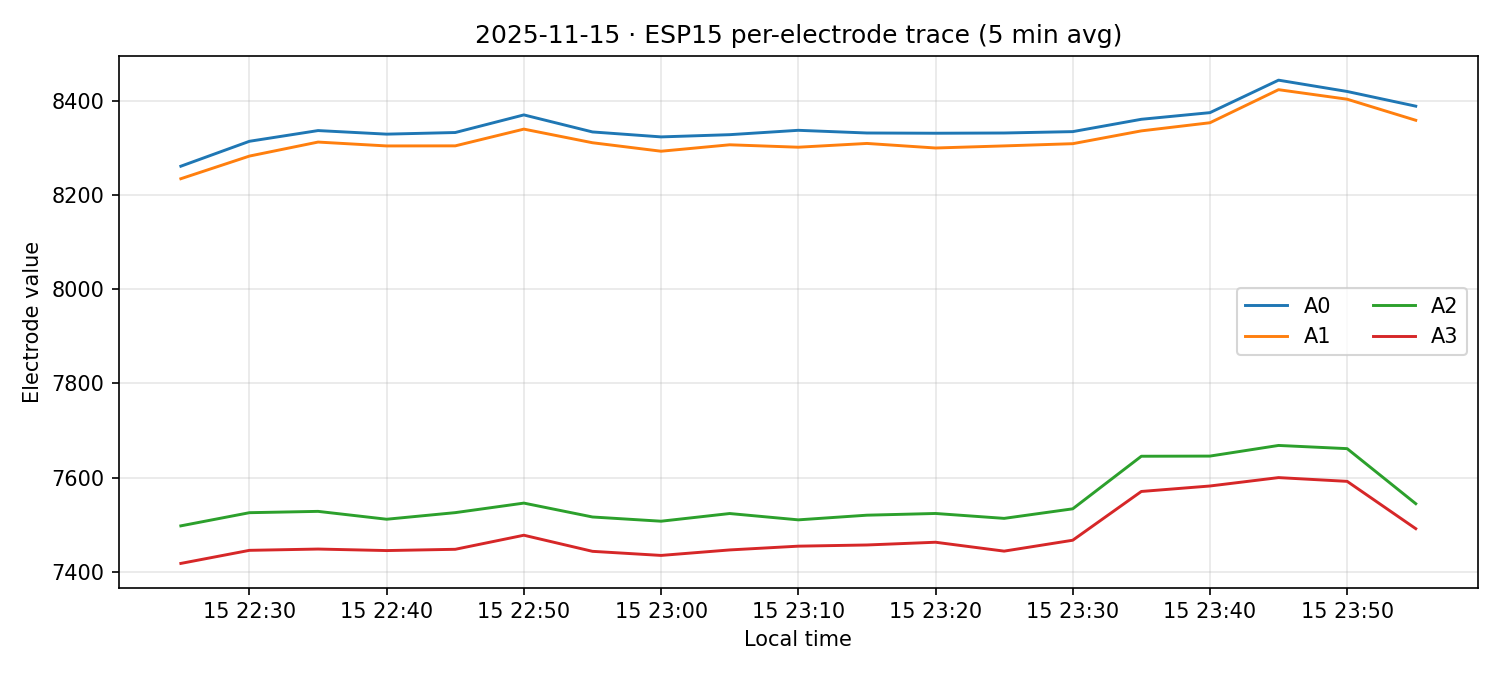
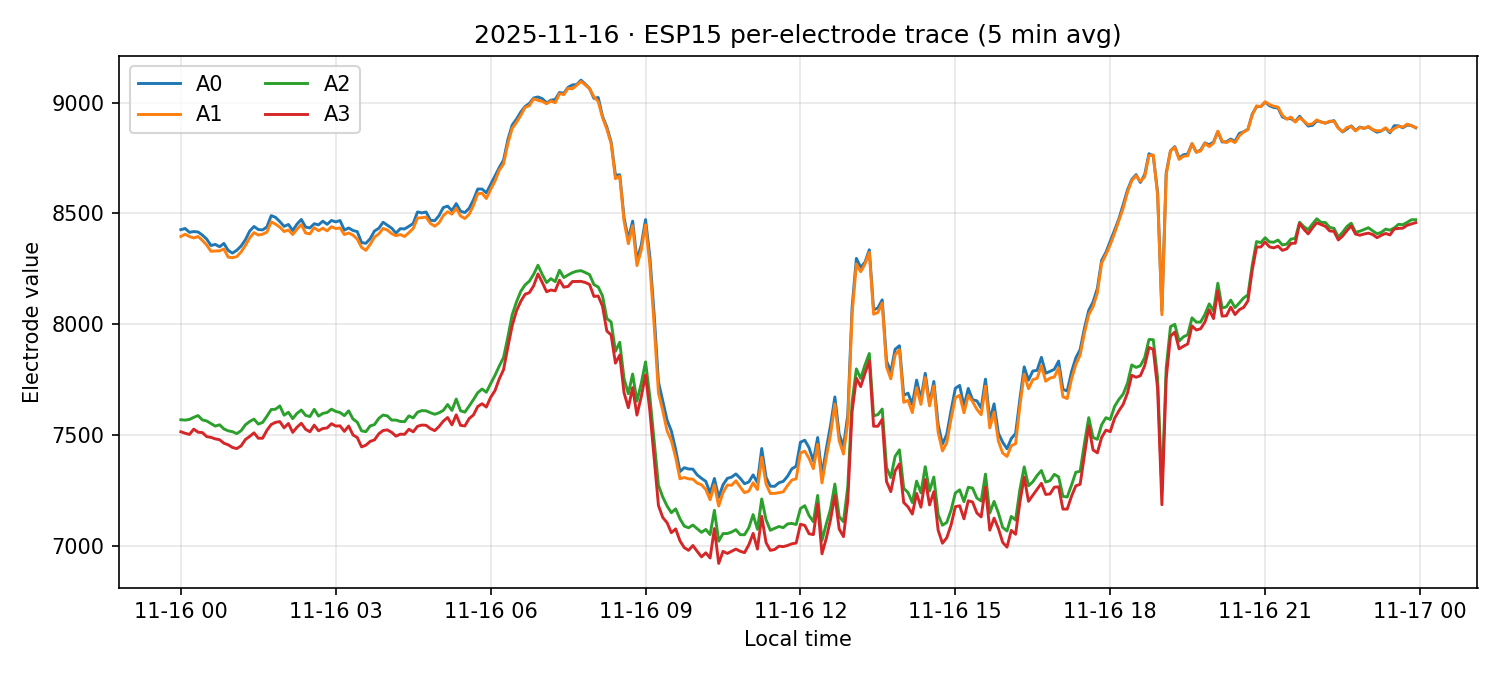
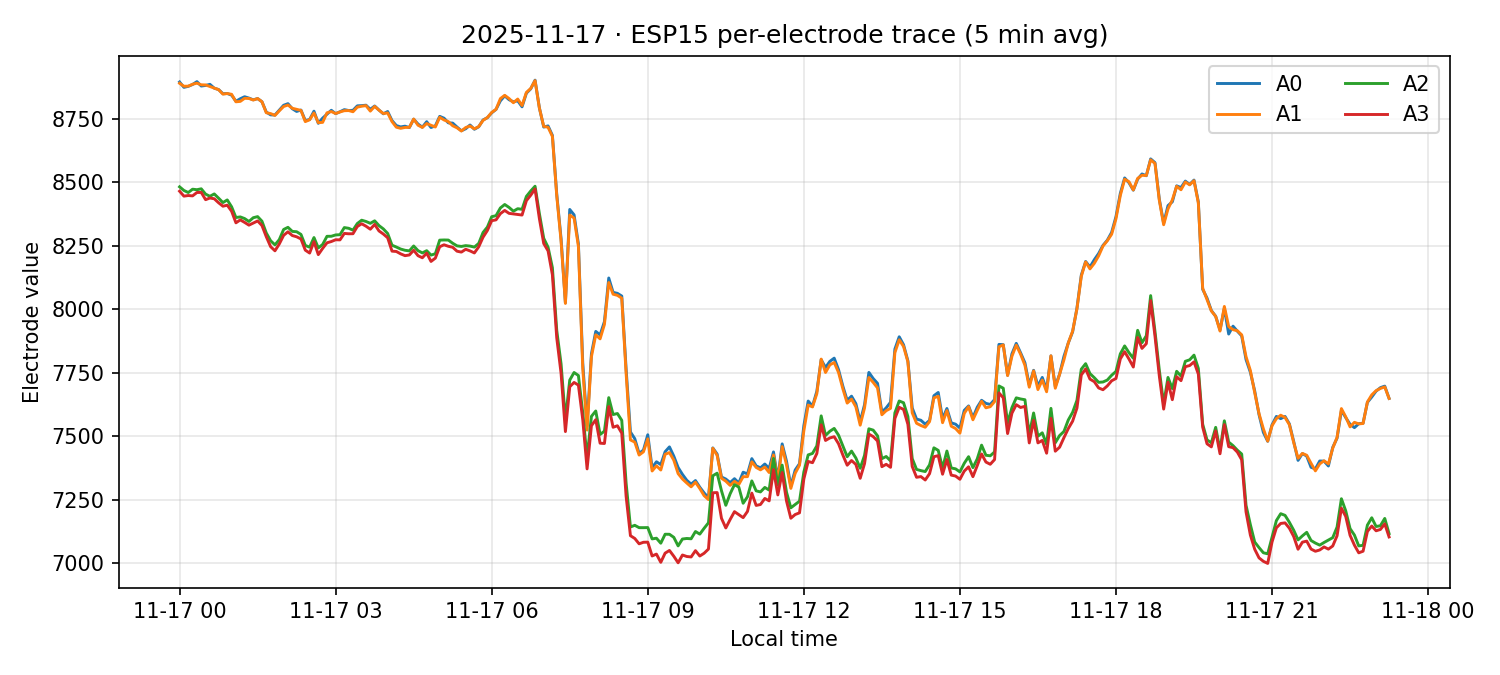
Run 1: Cups Configuration
November 15-17, 2025
How to use. Choose an ESP from the menu, then scrub through the days with the slider. "Show all" restores all days so you can compare days side-by-side.
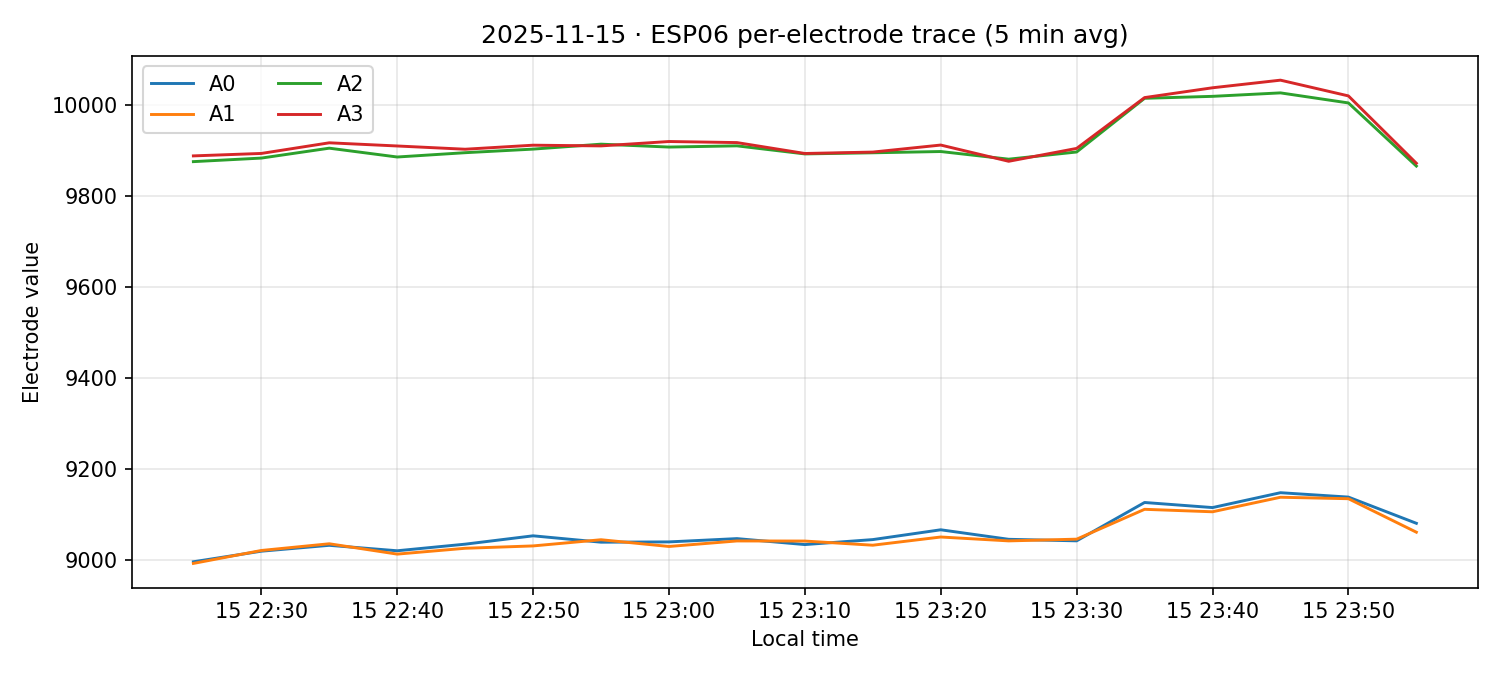
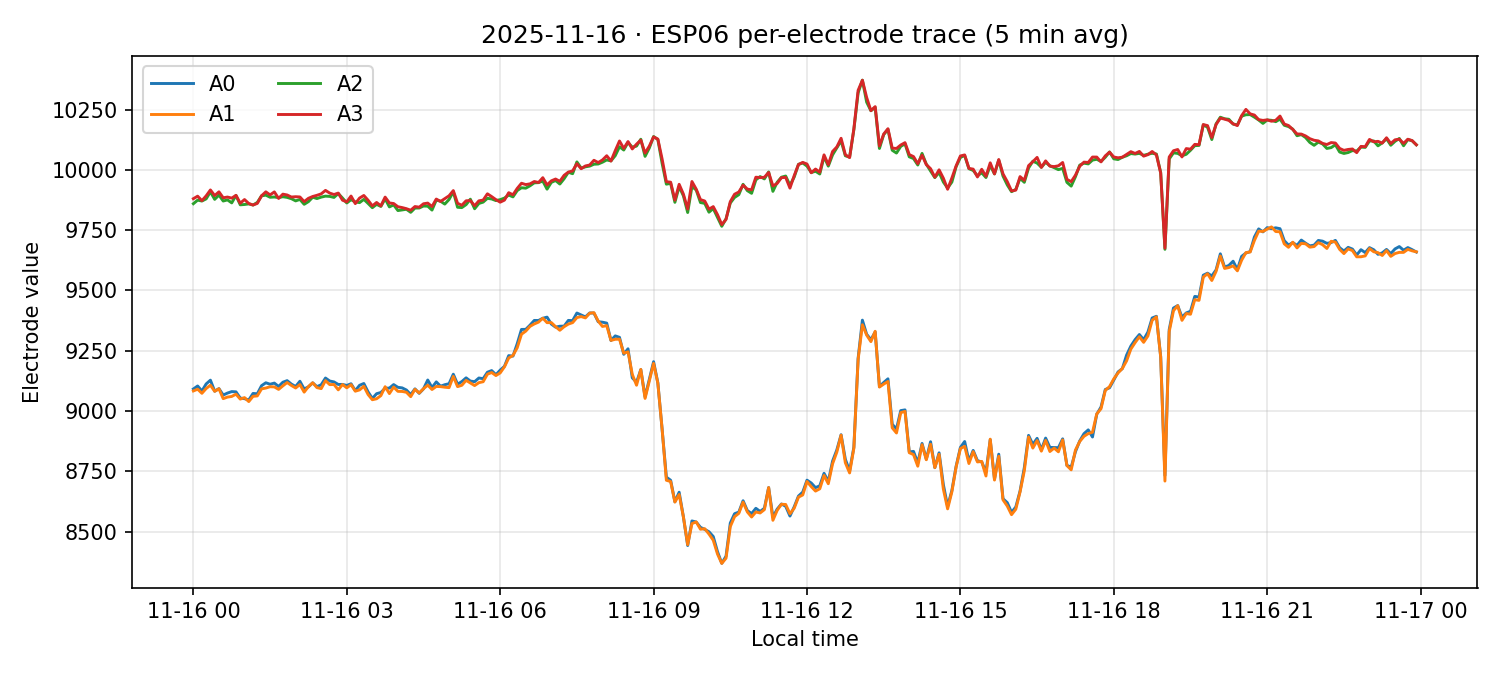
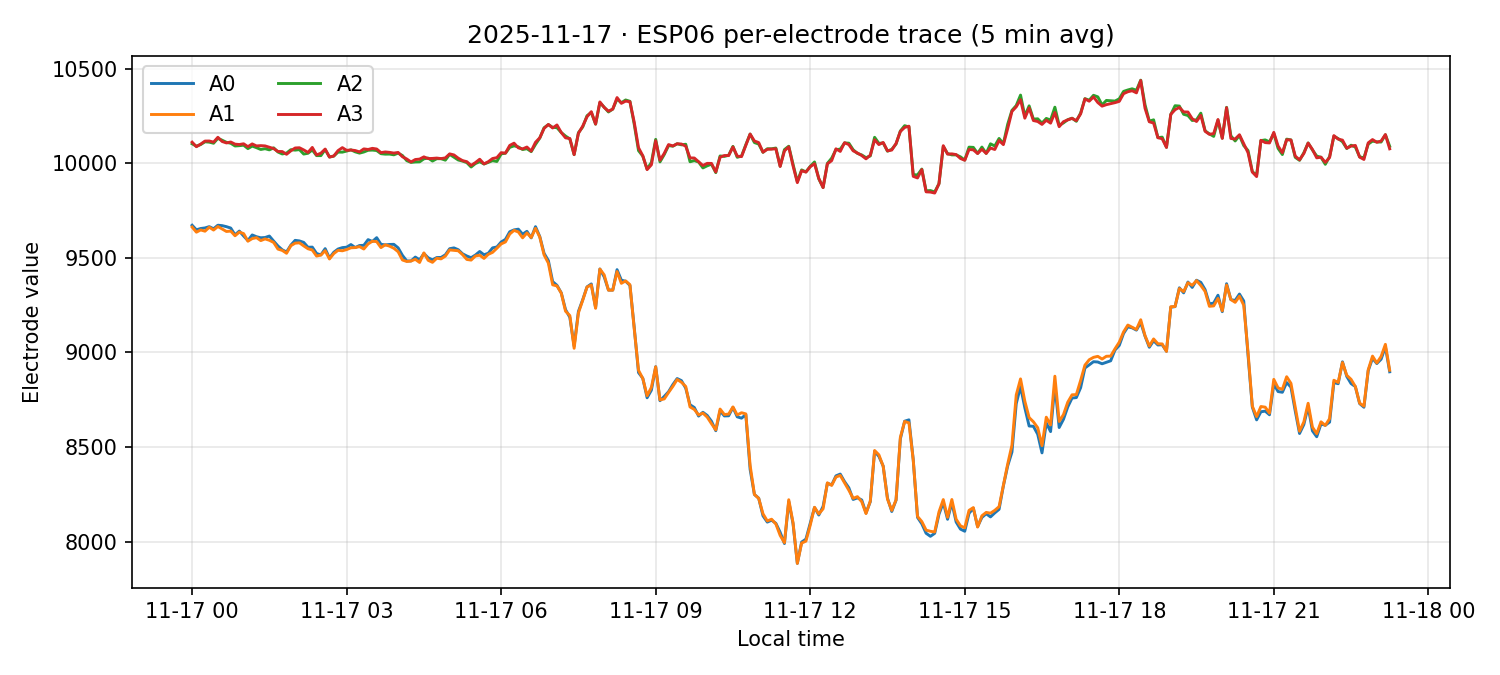
ESP06
Run 1: Cups Configuration
15 Nov 2025
| Electrode | Samples |
|---|---|
| A0 | 2,680 |
| A1 | 2,680 |
| A2 | 2,680 |
| A3 | 2,680 |
16 Nov 2025
| Electrode | Samples |
|---|---|
| A0 | 41,261 |
| A1 | 41,261 |
| A2 | 41,261 |
| A3 | 41,261 |
17 Nov 2025
| Electrode | Samples |
|---|---|
| A0 | 37,380 |
| A1 | 37,380 |
| A2 | 37,380 |
| A3 | 37,380 |
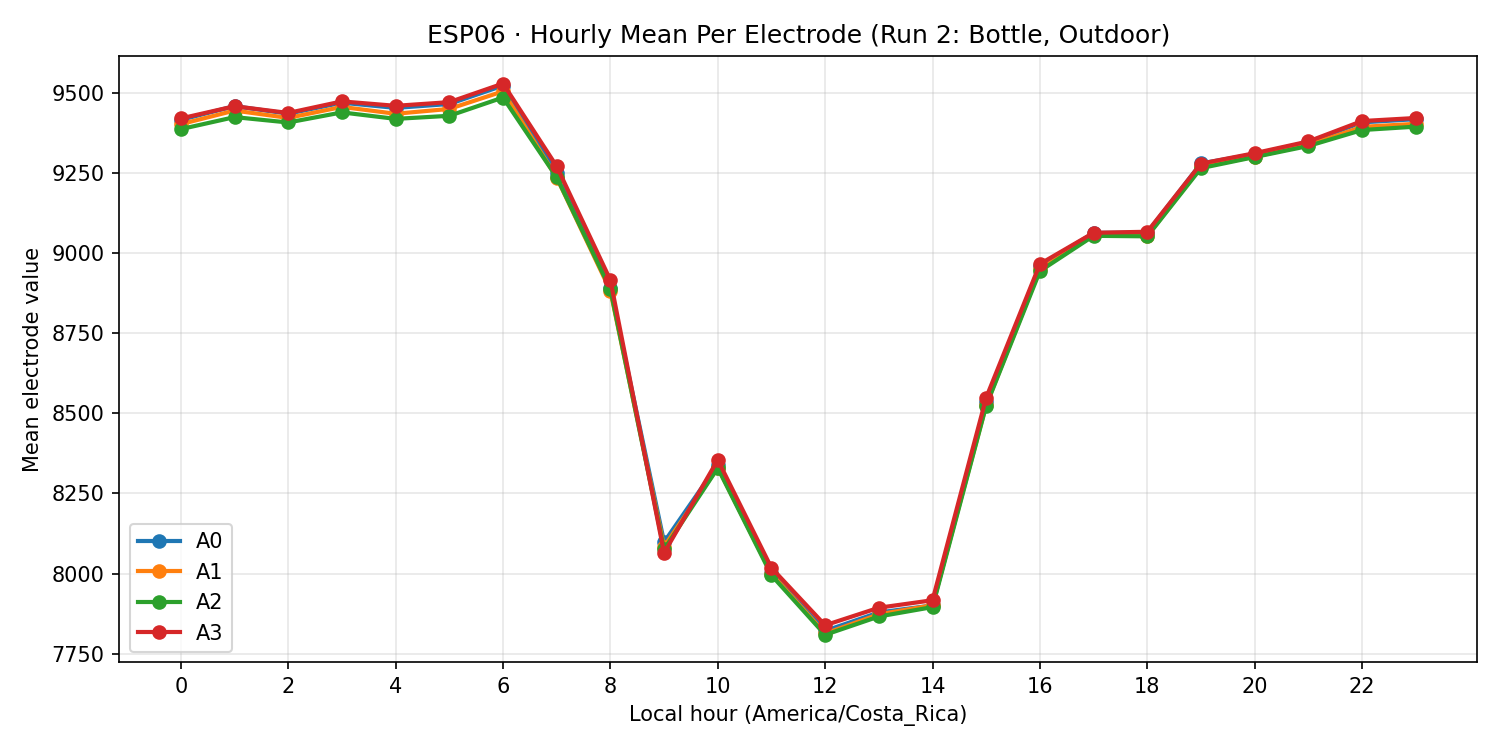
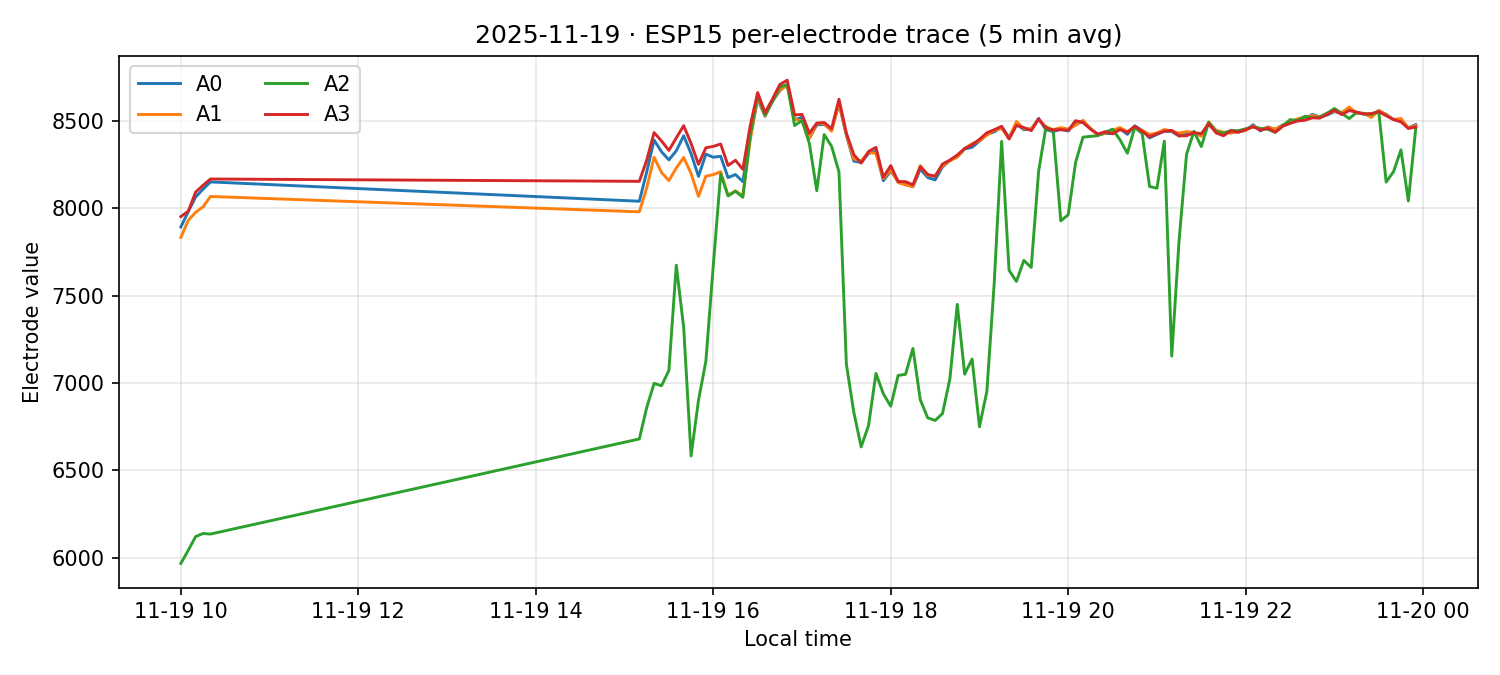
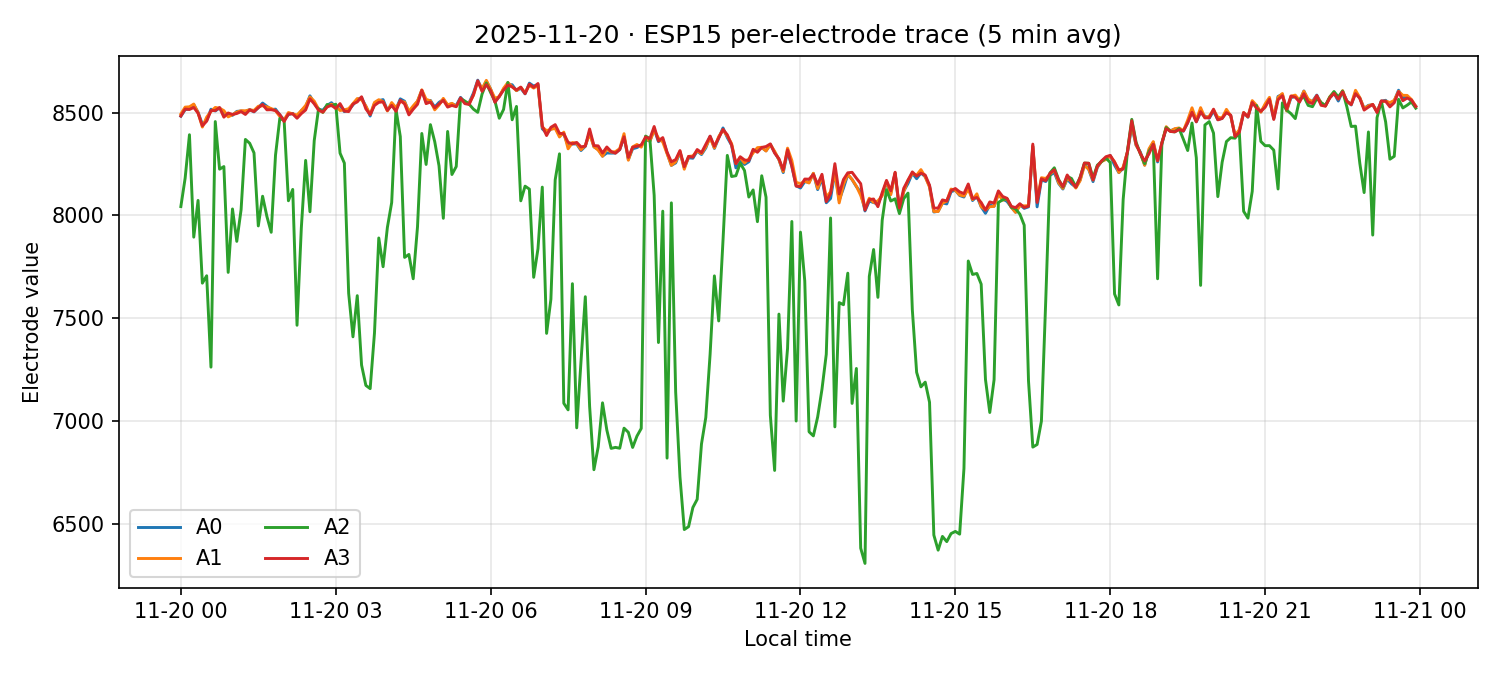
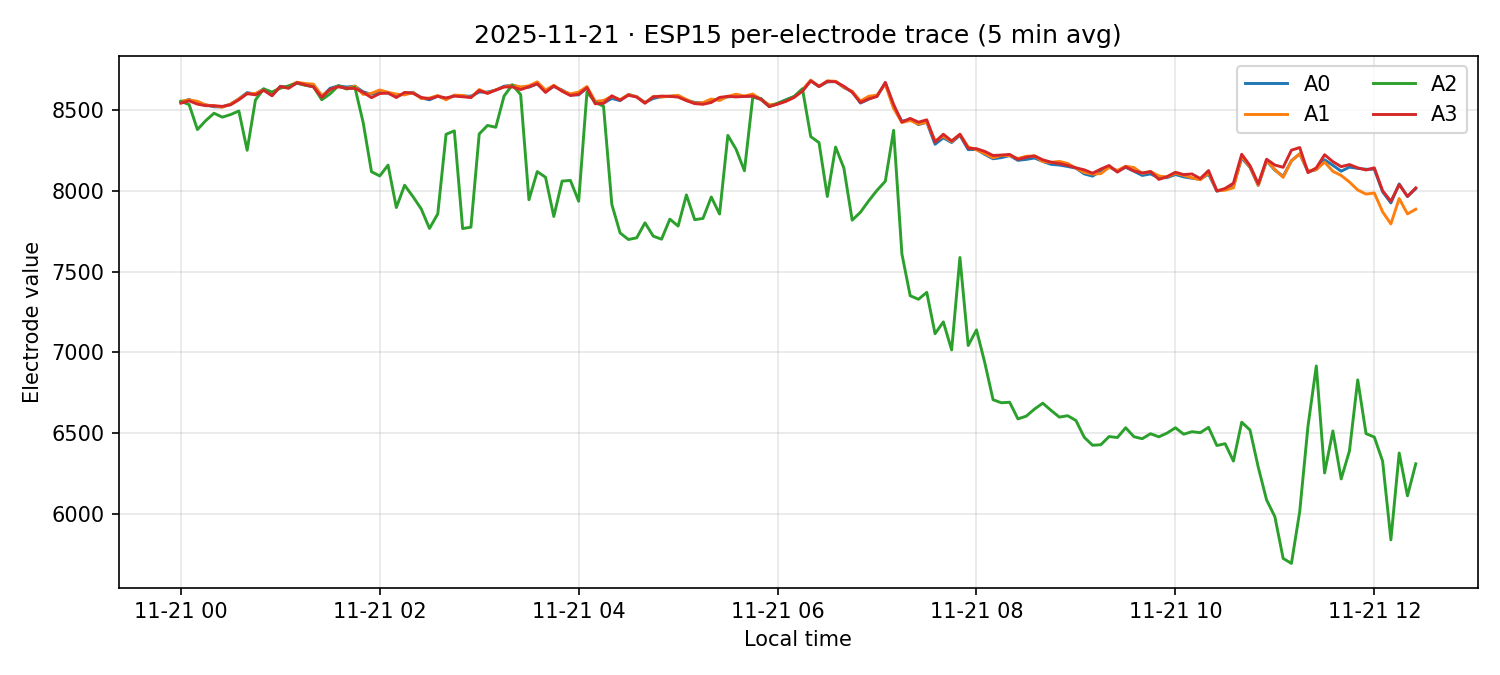
Run 2: Bottle, Outdoor
November 19-21, 2025
How to use. Choose an ESP from the menu, then scrub through the days with the slider. "Show all" restores all days so you can compare days side-by-side.
ESP06
Run 2: Bottle, Outdoor
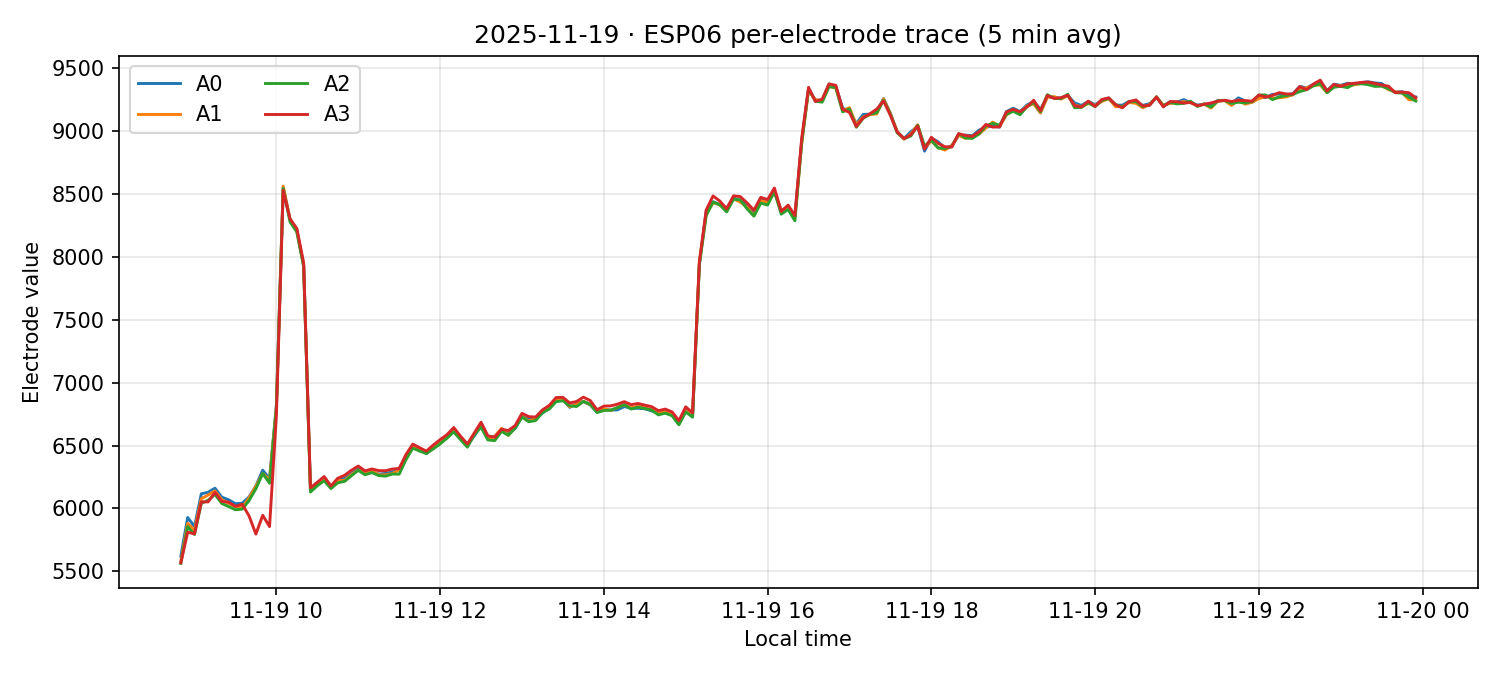
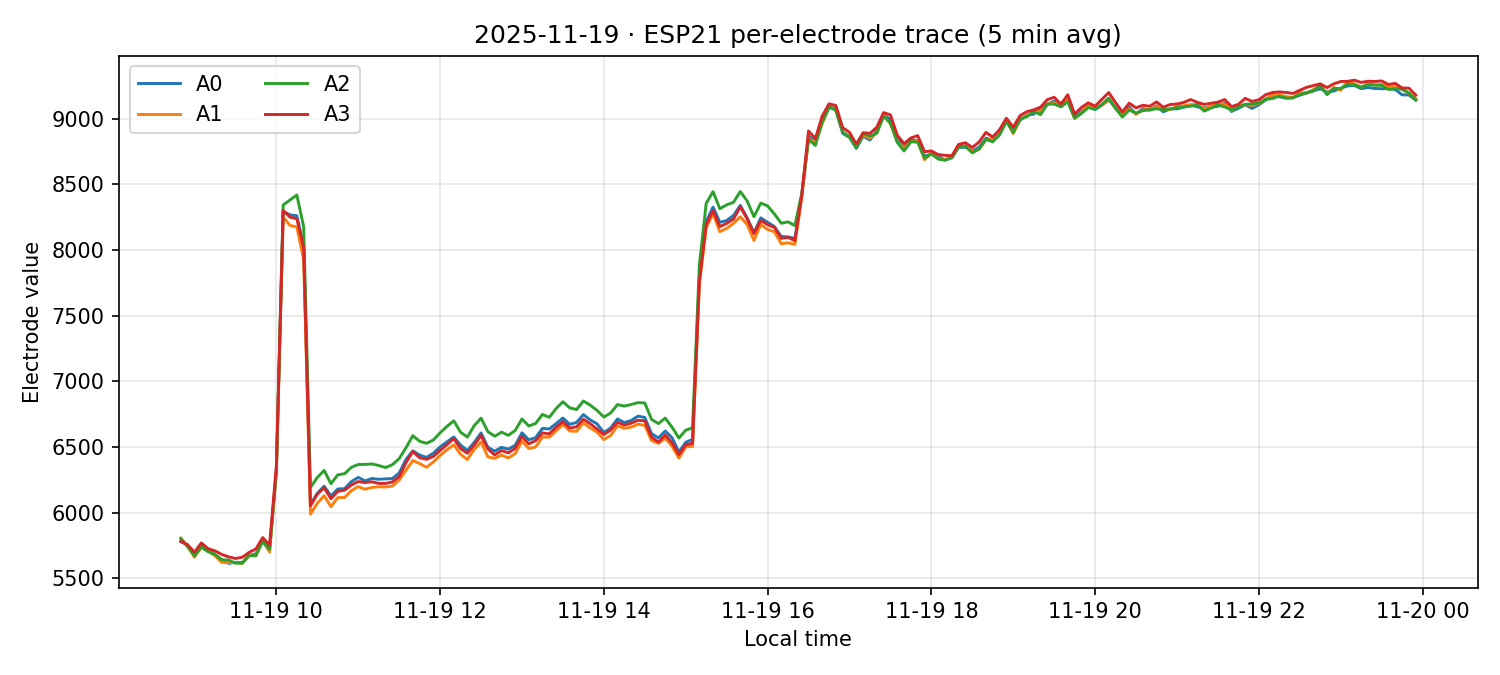
19 Nov 2025
| Electrode | Samples |
|---|---|
| A0 | 24,449 |
| A1 | 24,449 |
| A2 | 24,449 |
| A3 | 24,449 |
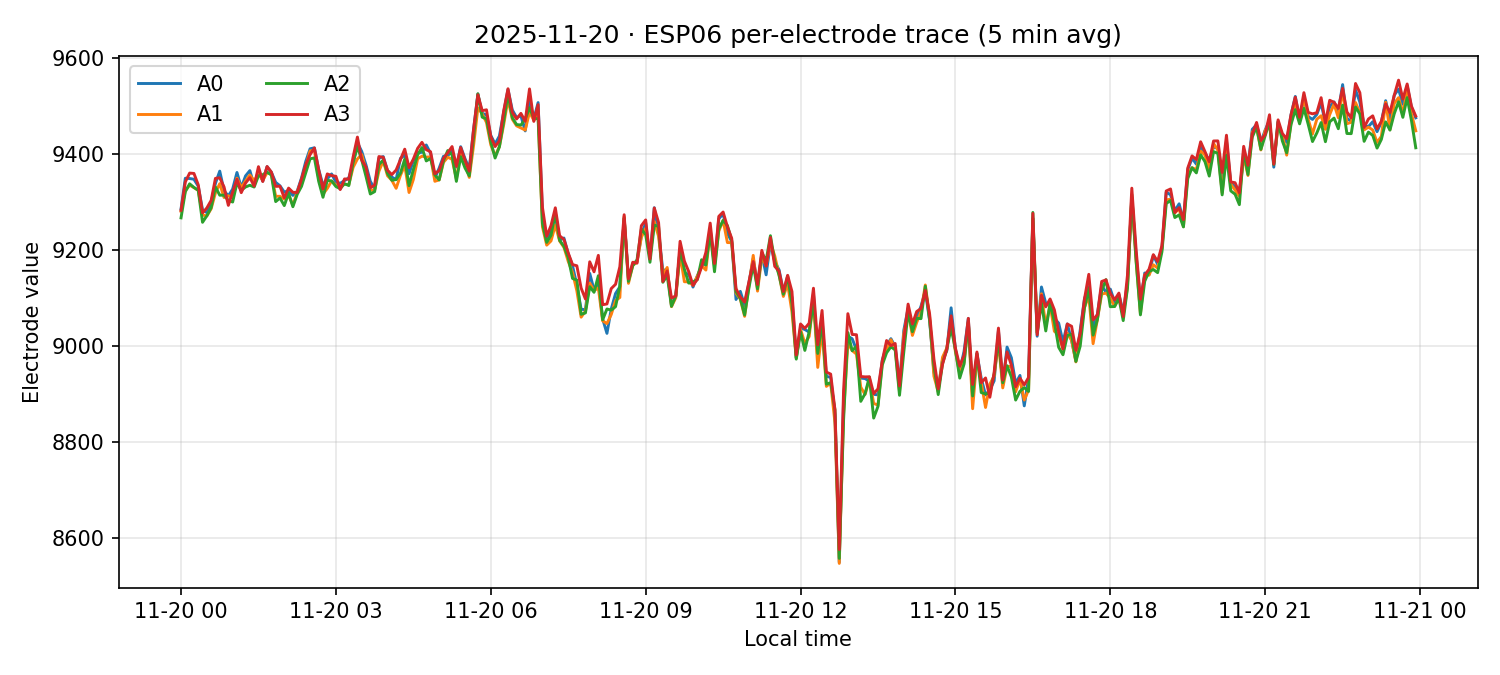
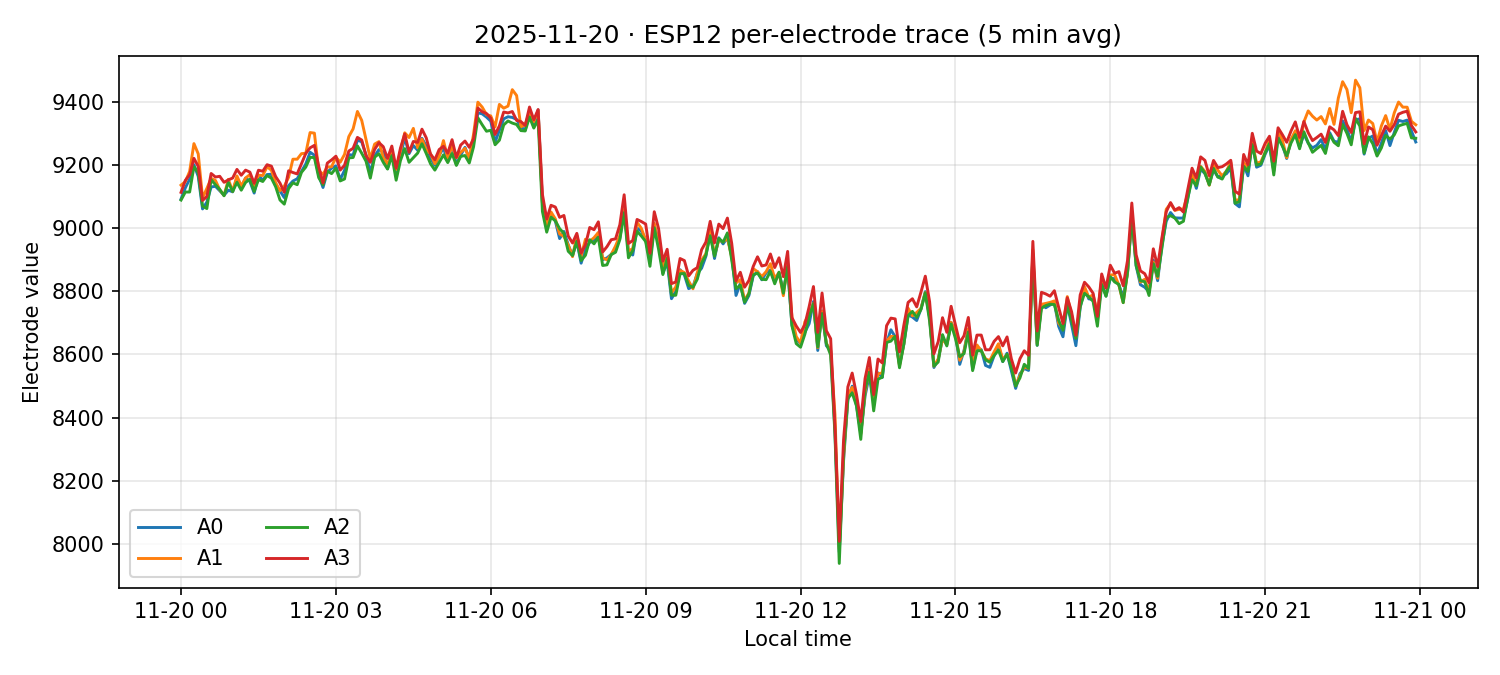
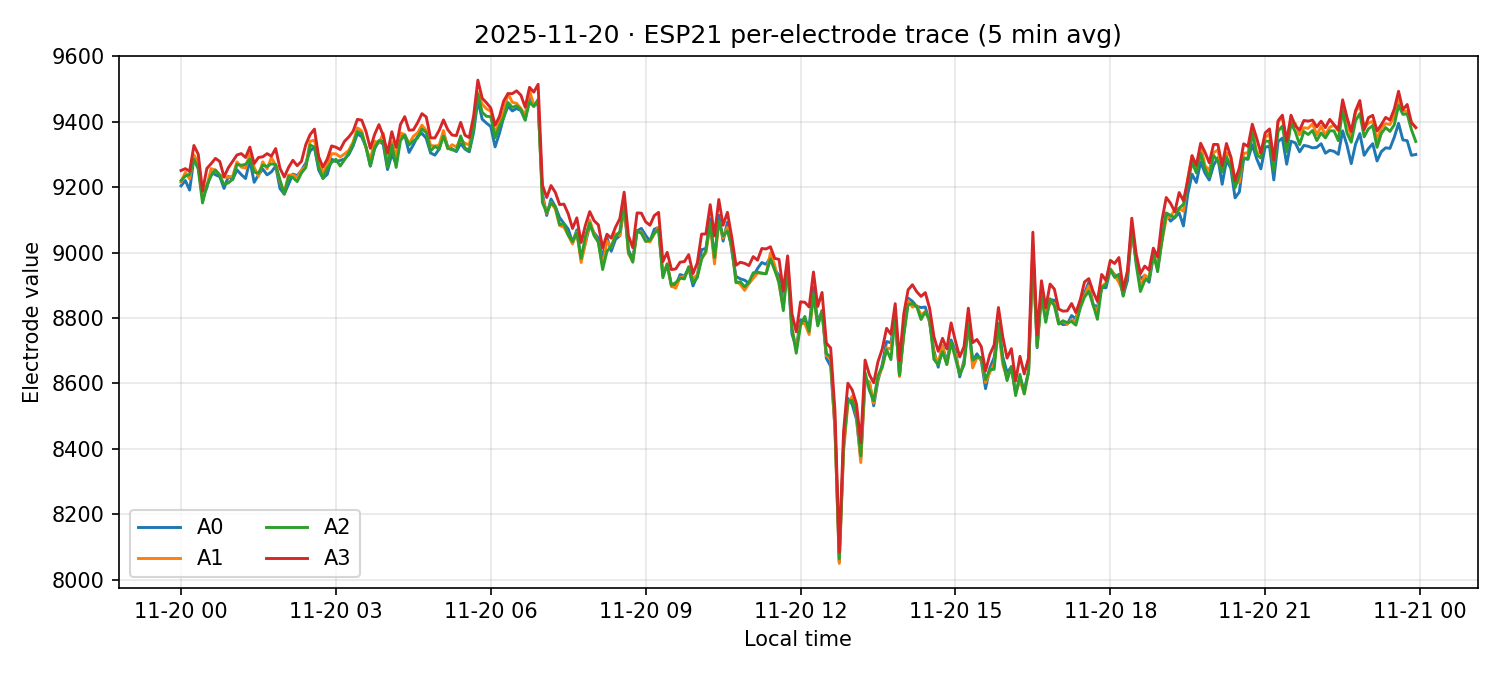
20 Nov 2025
| Electrode | Samples |
|---|---|
| A0 | 38,285 |
| A1 | 38,285 |
| A2 | 38,285 |
| A3 | 38,285 |
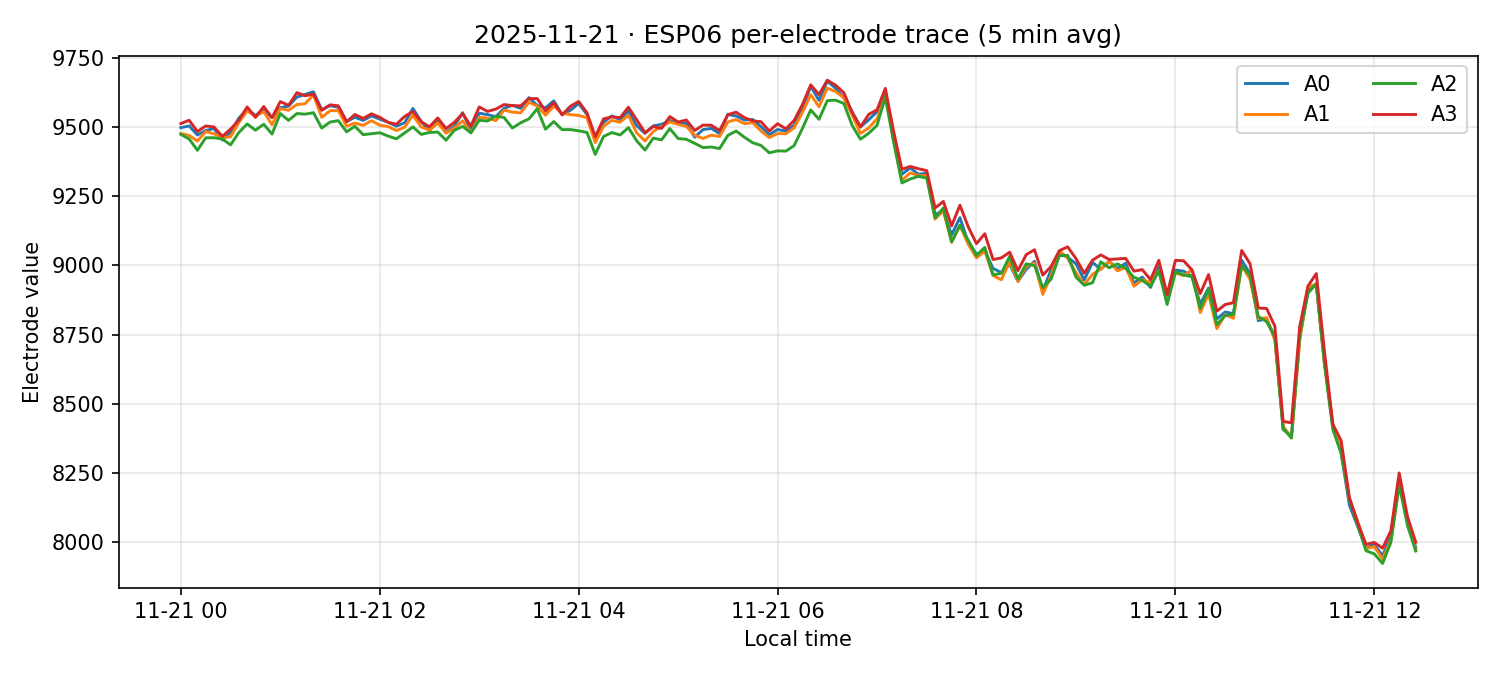
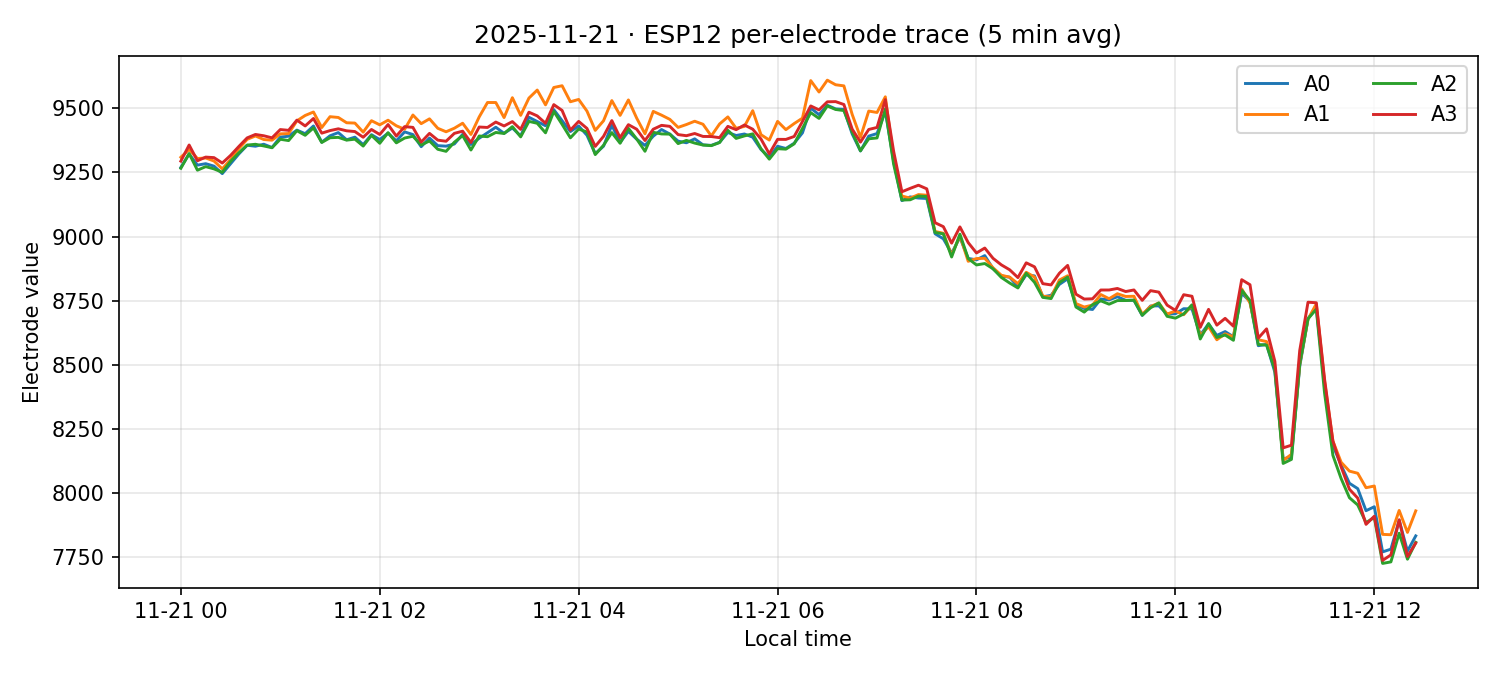
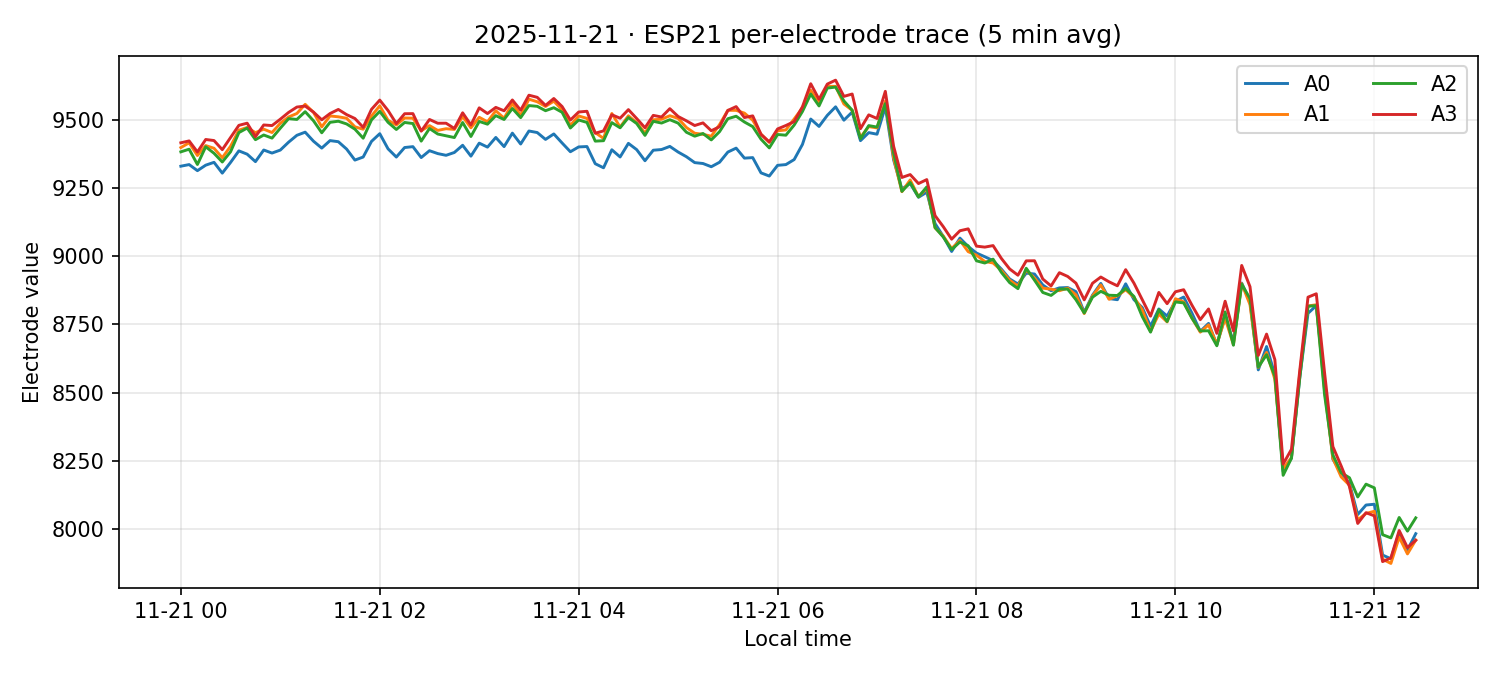
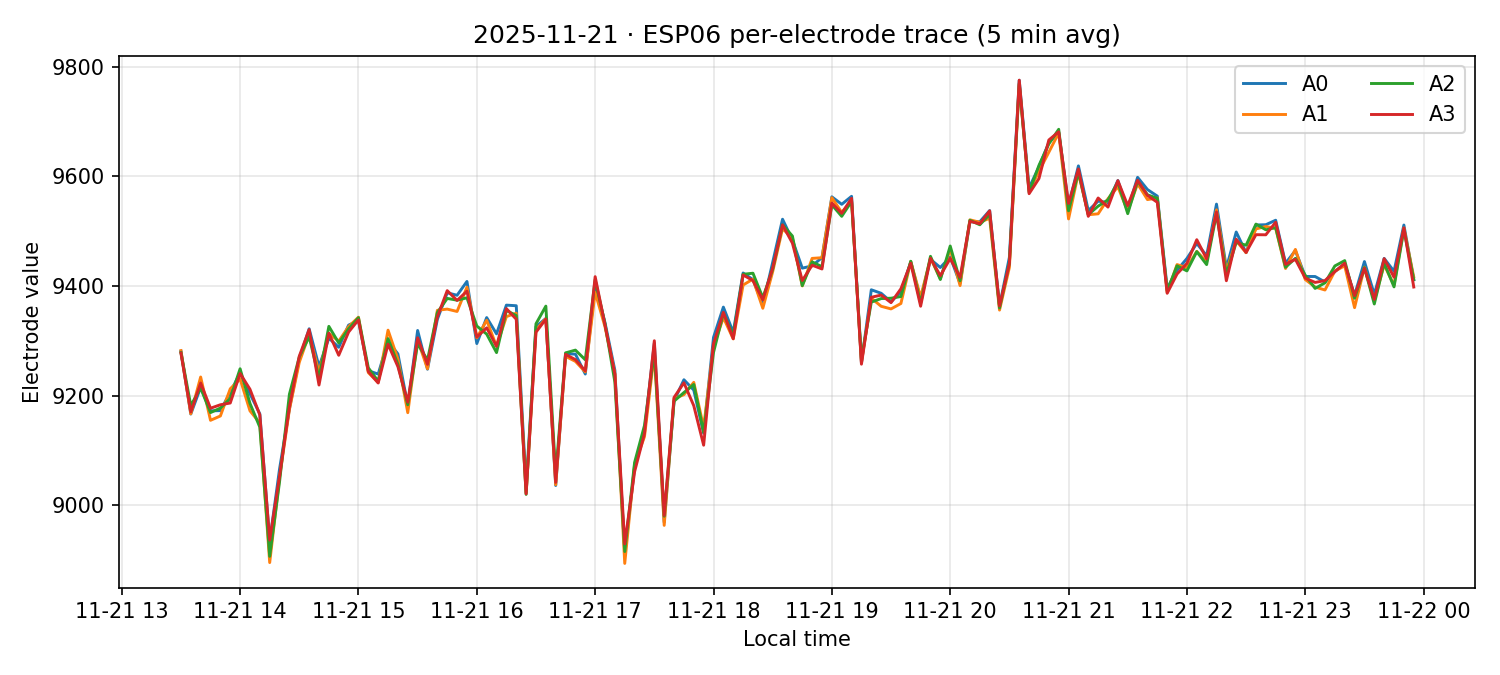
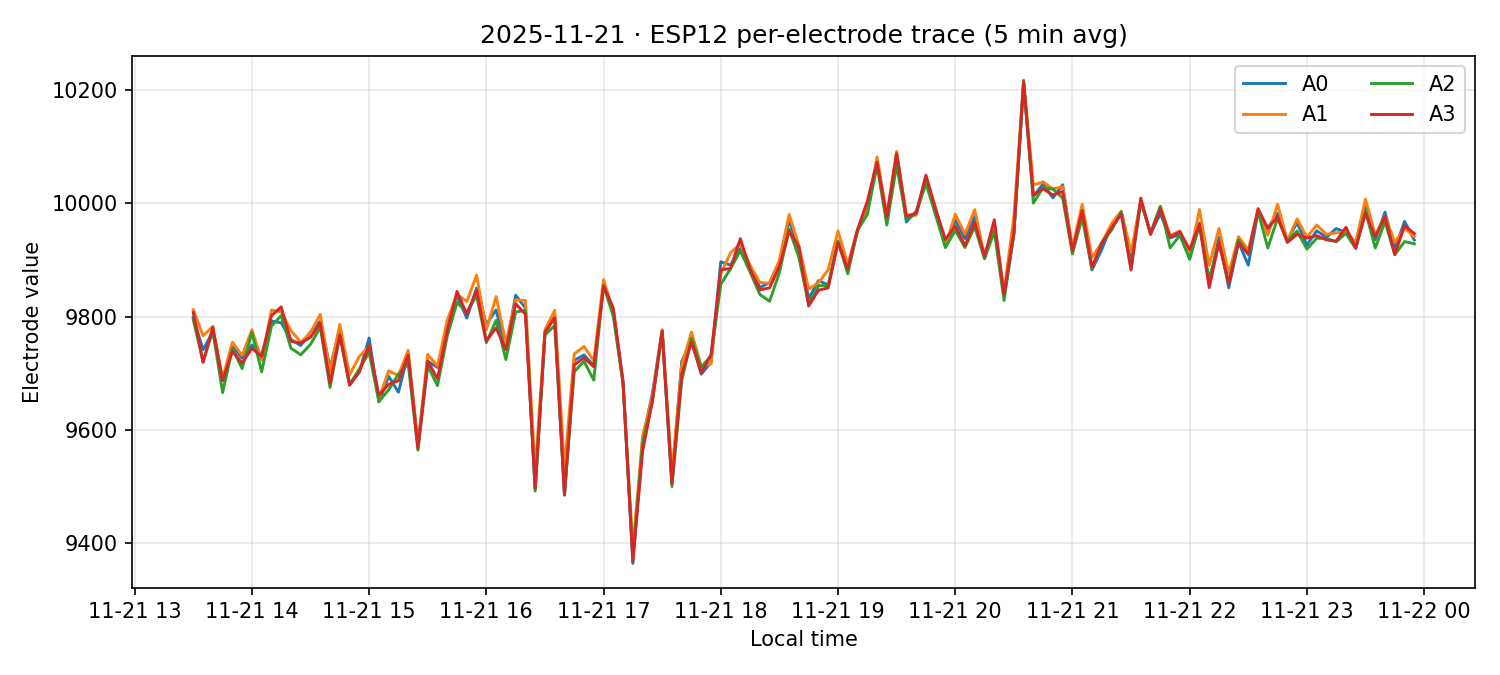
21 Nov 2025
| Electrode | Samples |
|---|---|
| A0 | 19,381 |
| A1 | 19,381 |
| A2 | 19,381 |
| A3 | 19,381 |
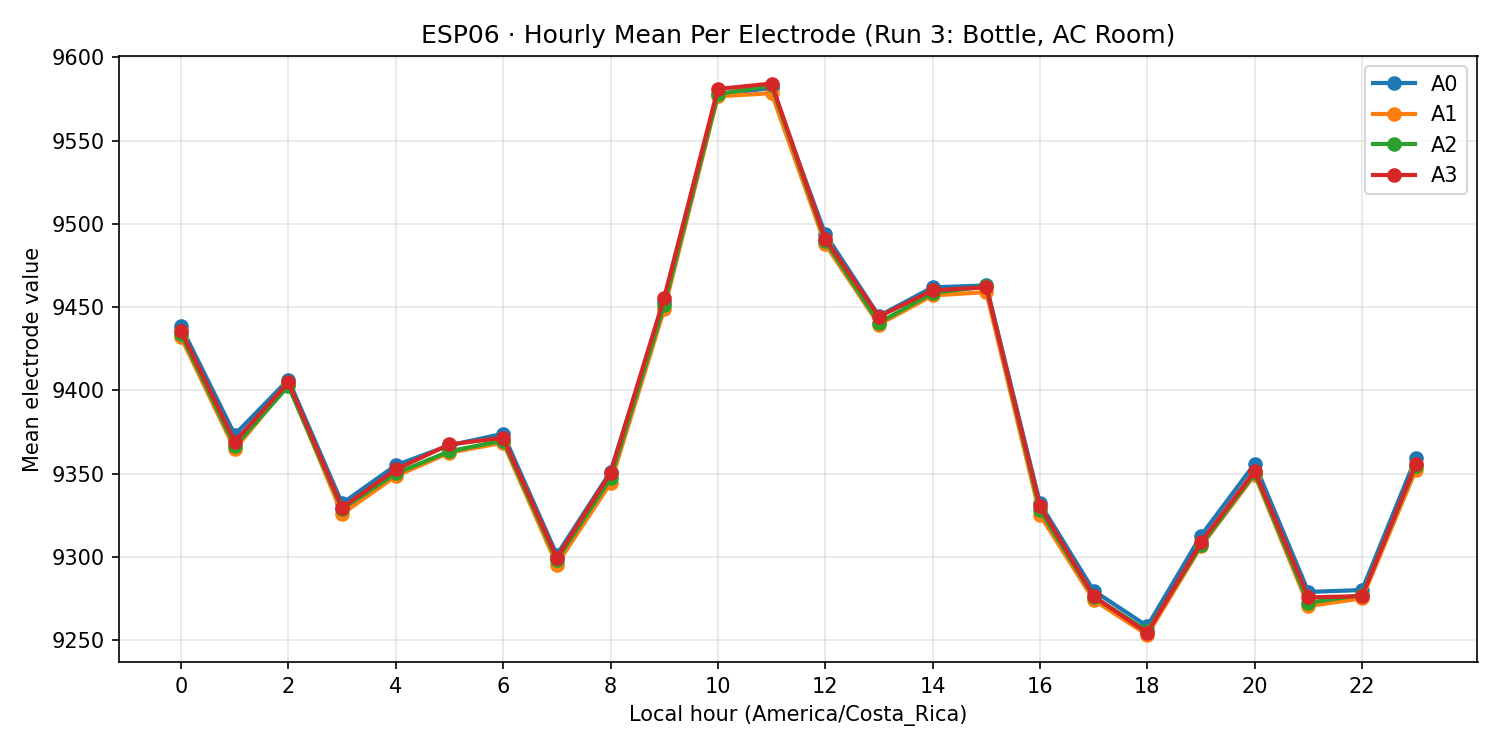
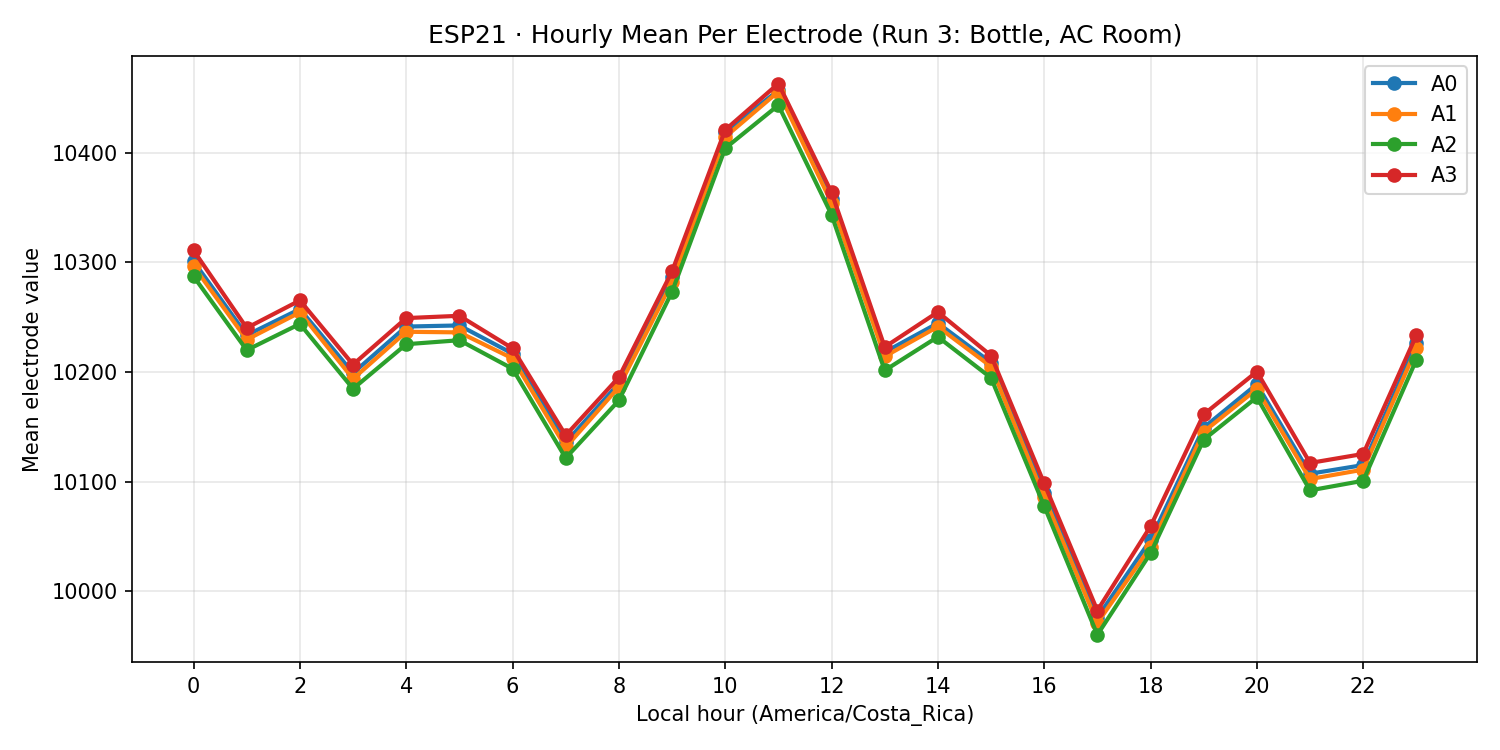
Run 3: Bottle, AC Room
November 21-26, 2025
How to use. Choose an ESP from the menu, then scrub through the days with the slider. "Show all" restores all days so you can compare days side-by-side.
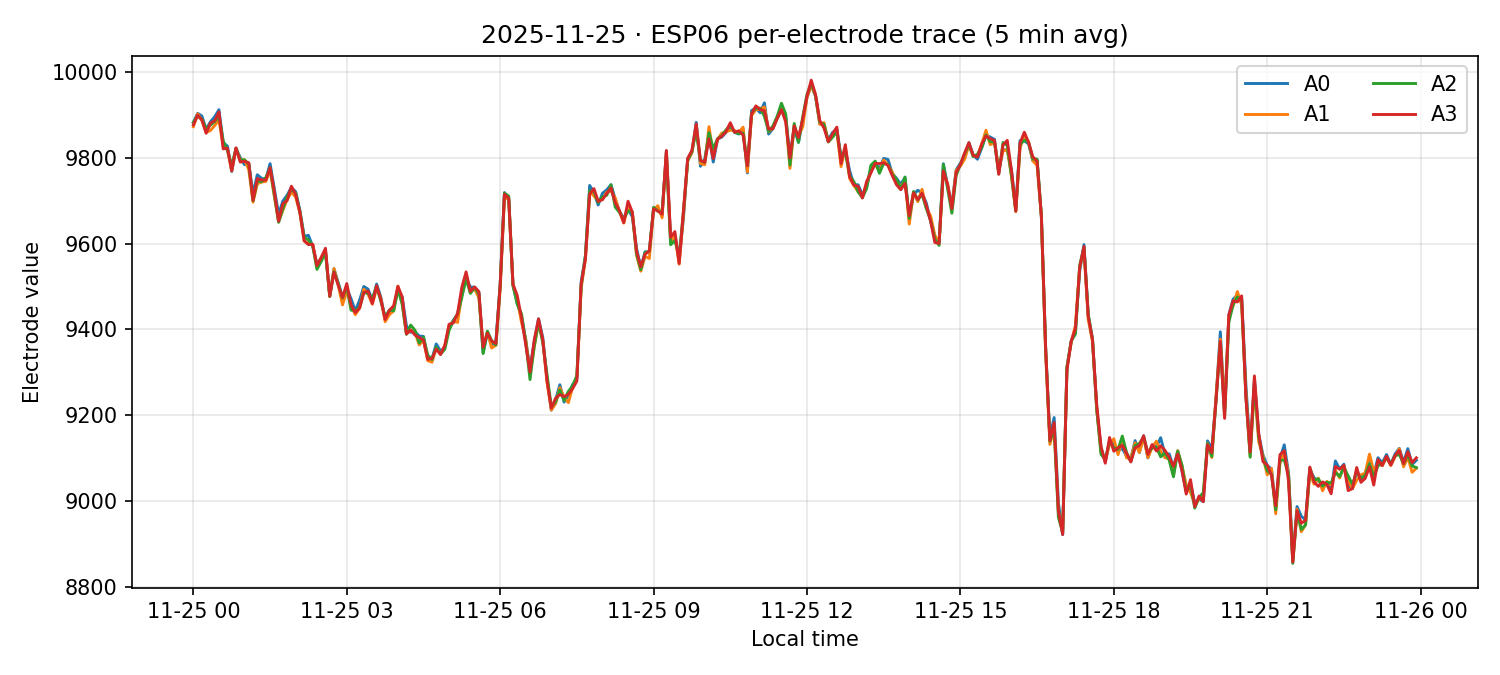
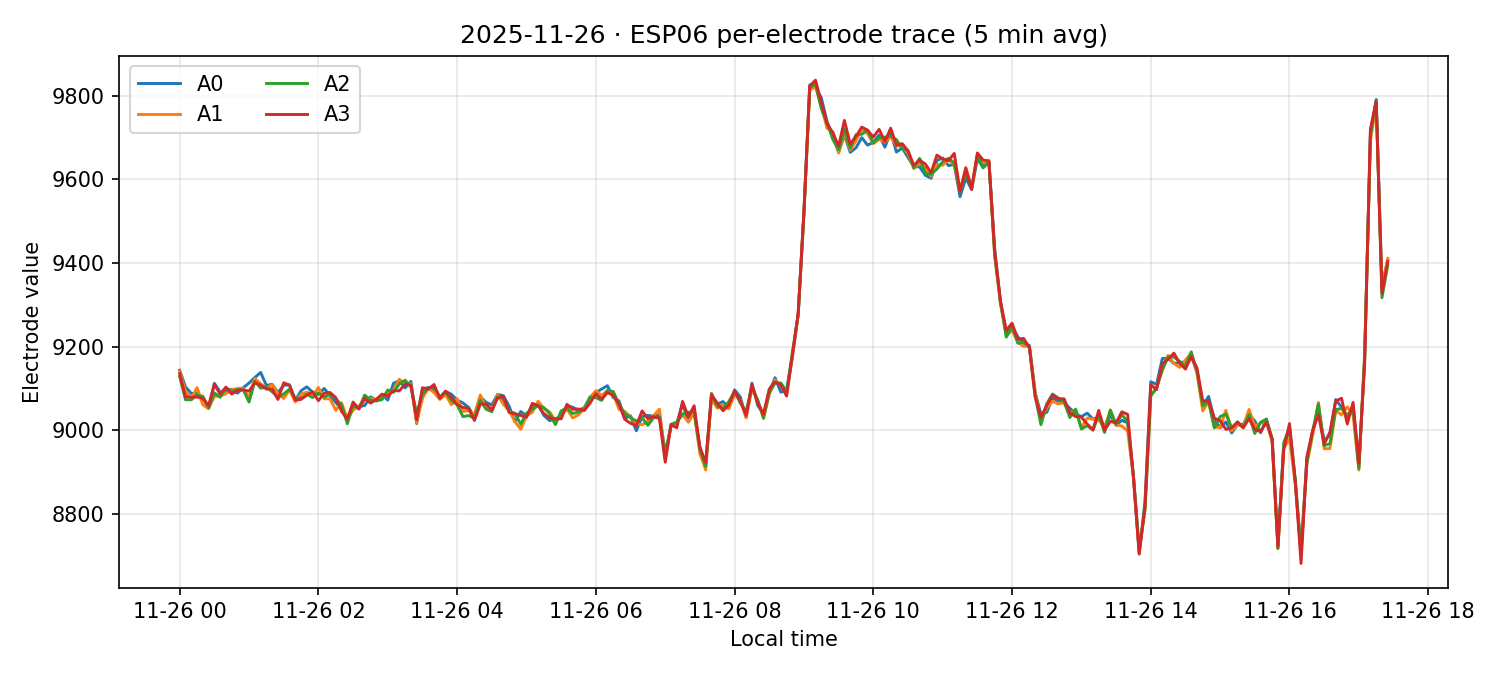
ESP06
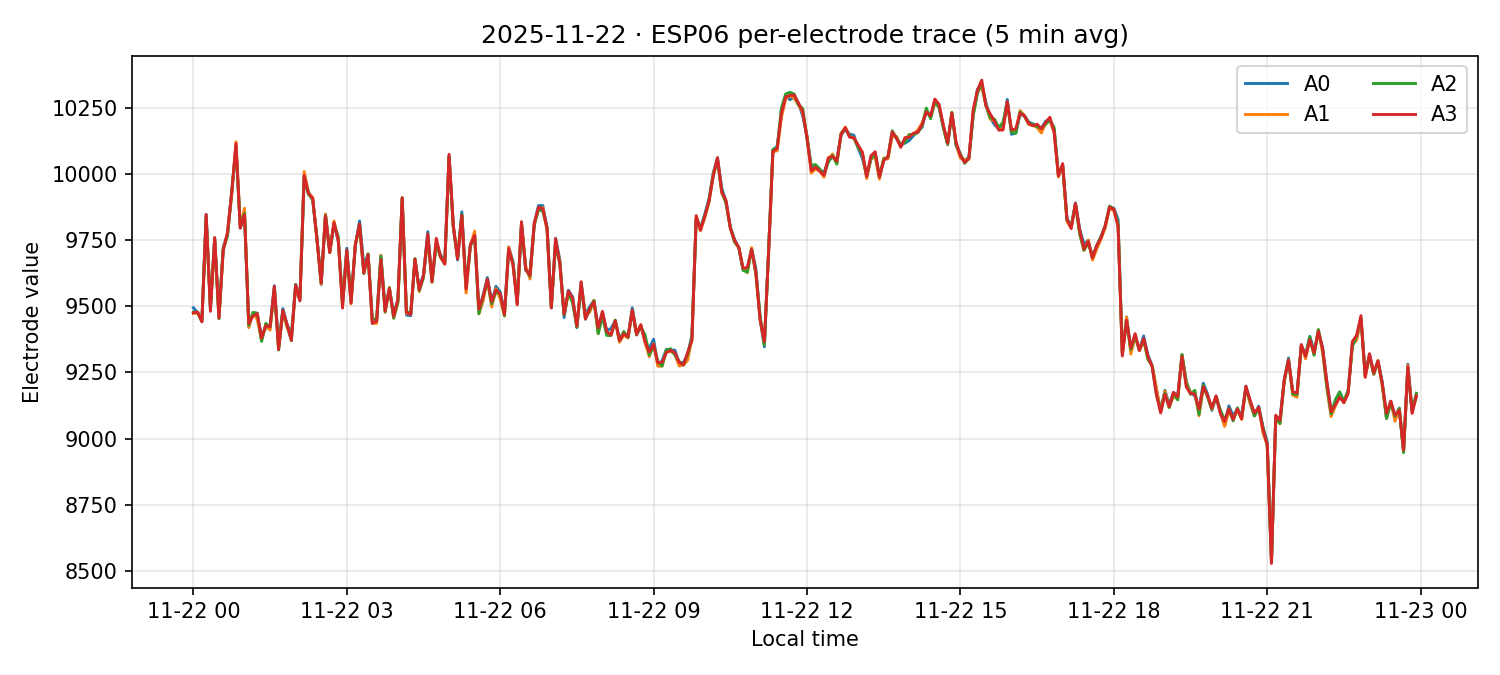
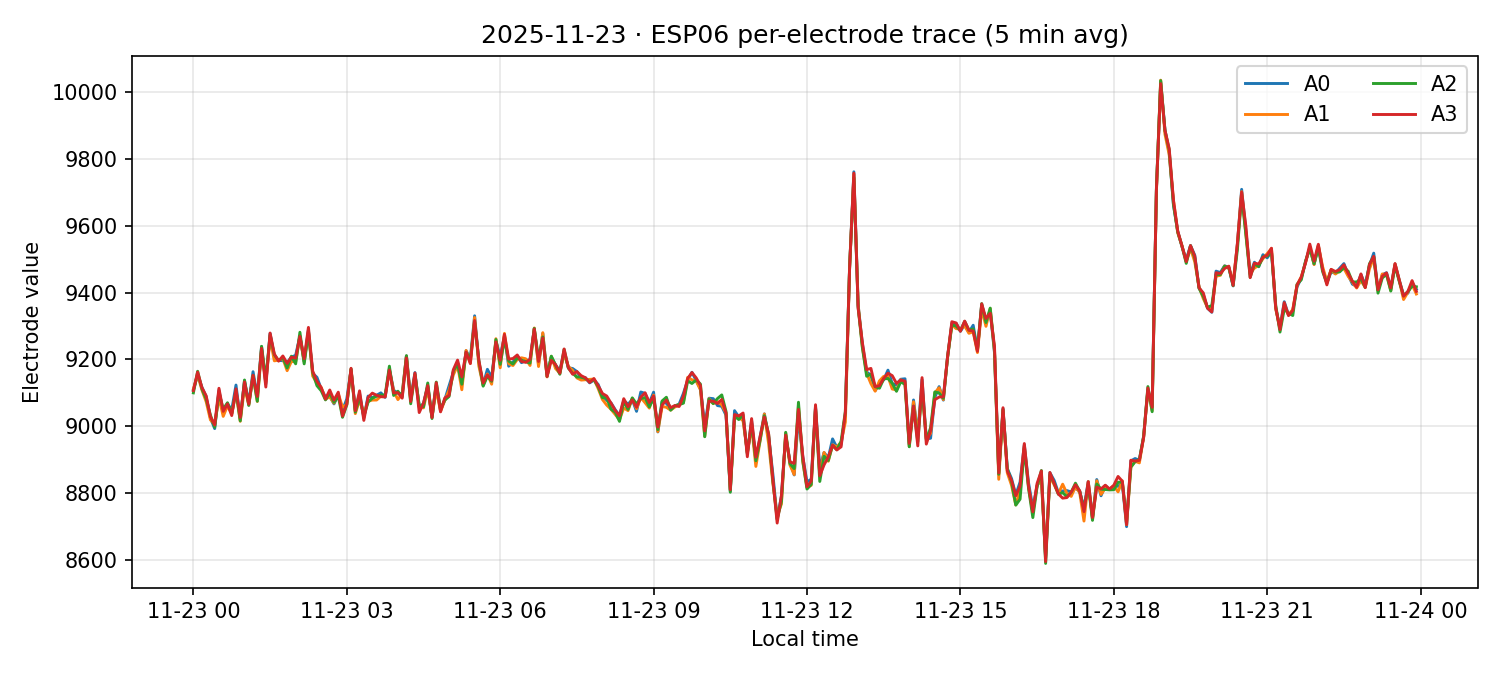
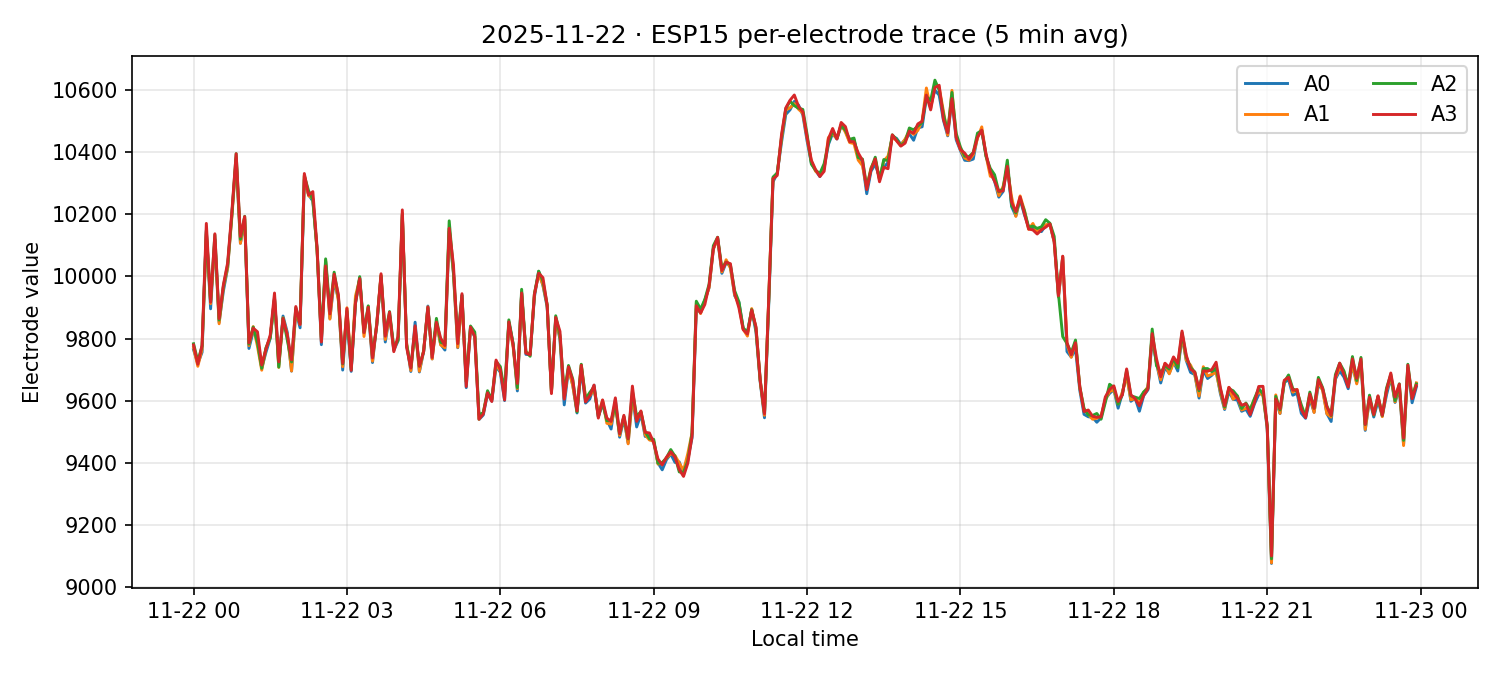
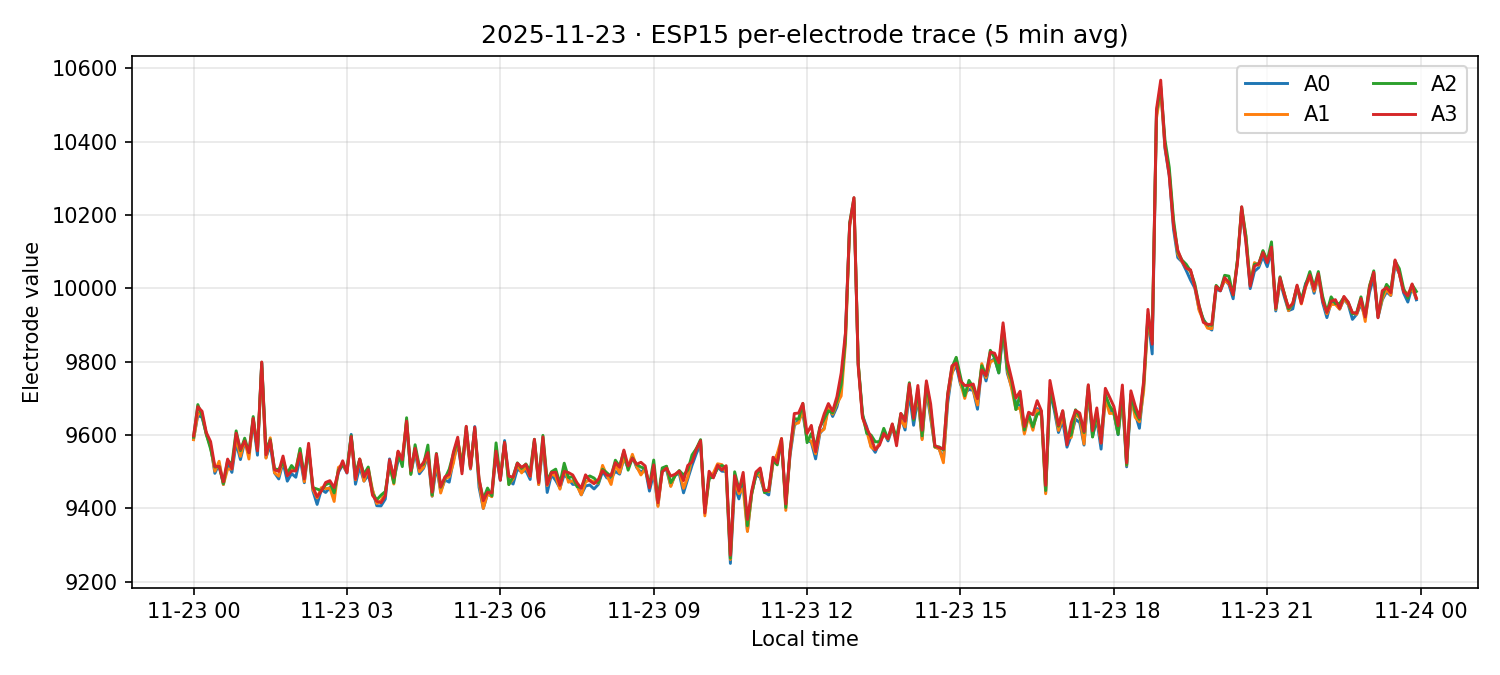
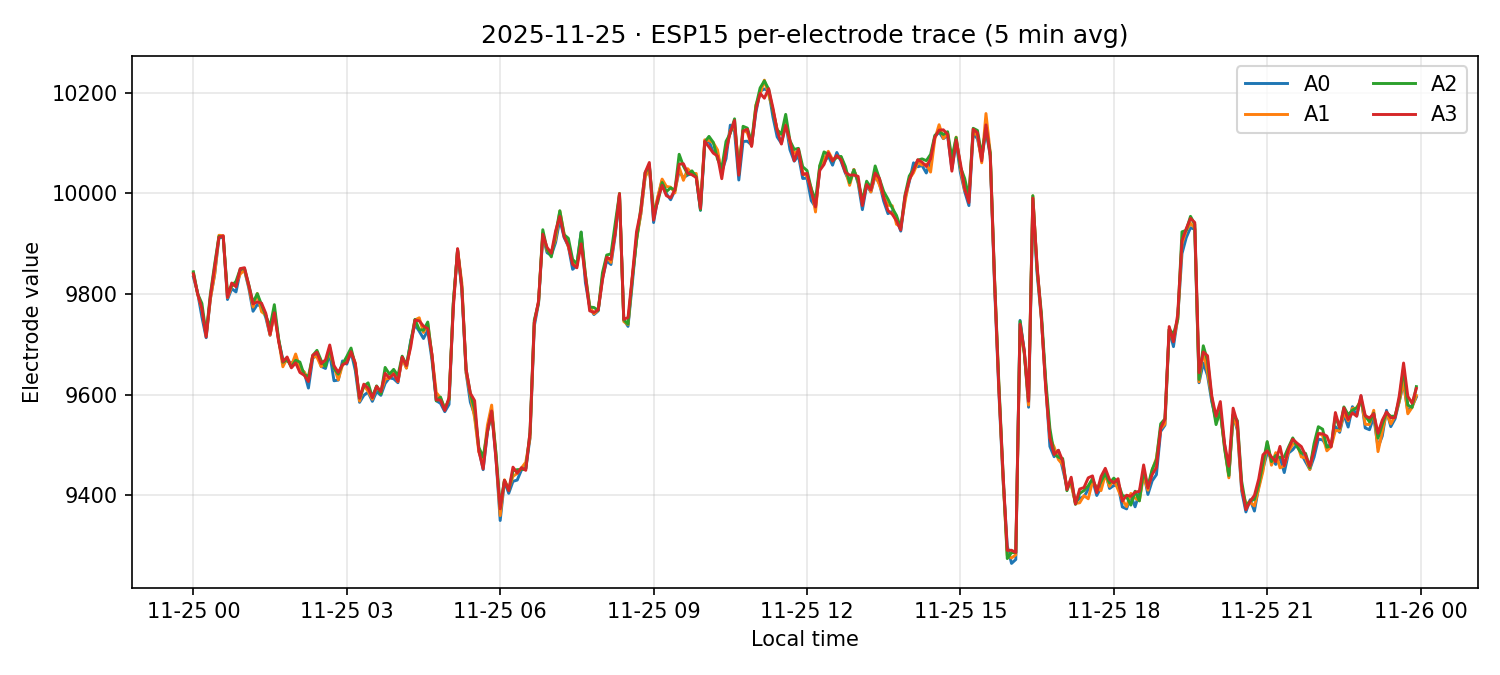
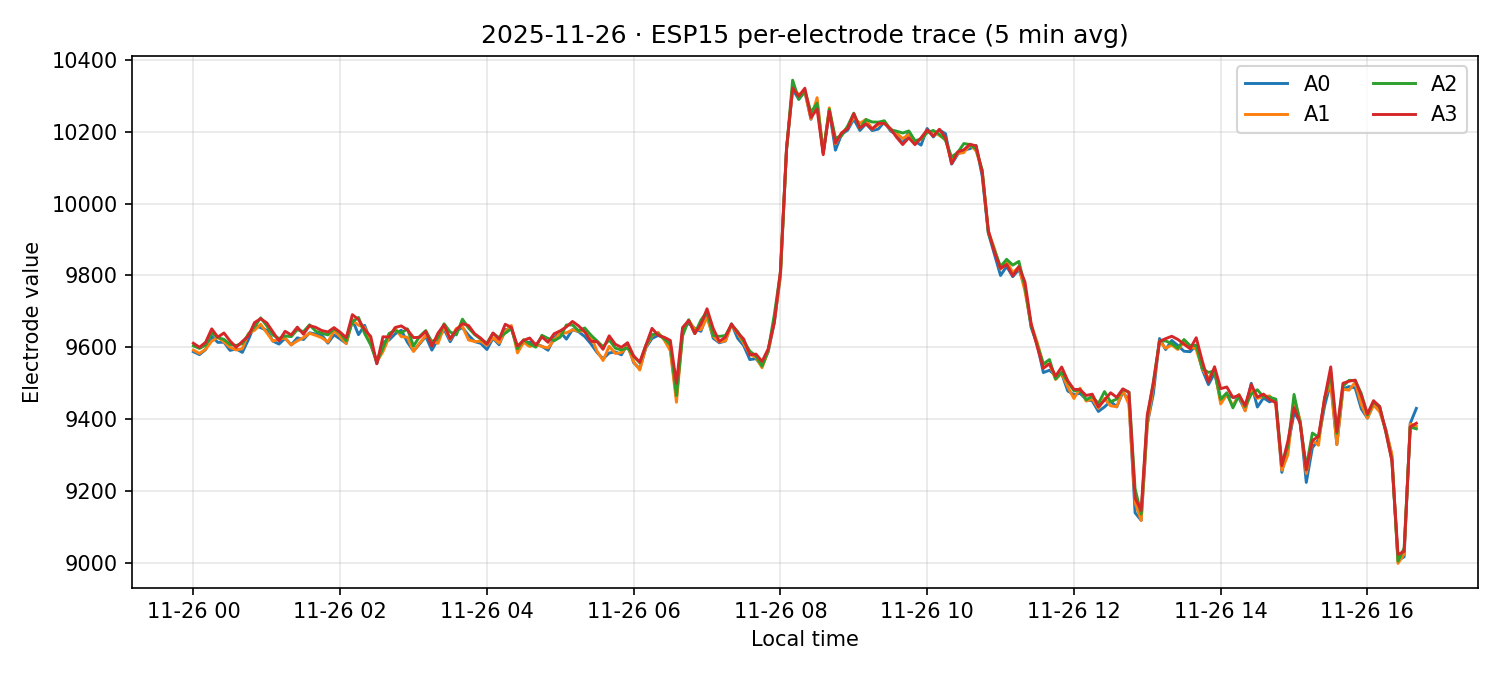
Run 3: Bottle, AC Room
21 Nov 2025
| Electrode | Samples |
|---|---|
| A0 | 17,164 |
| A1 | 17,164 |
| A2 | 17,164 |
| A3 | 17,164 |
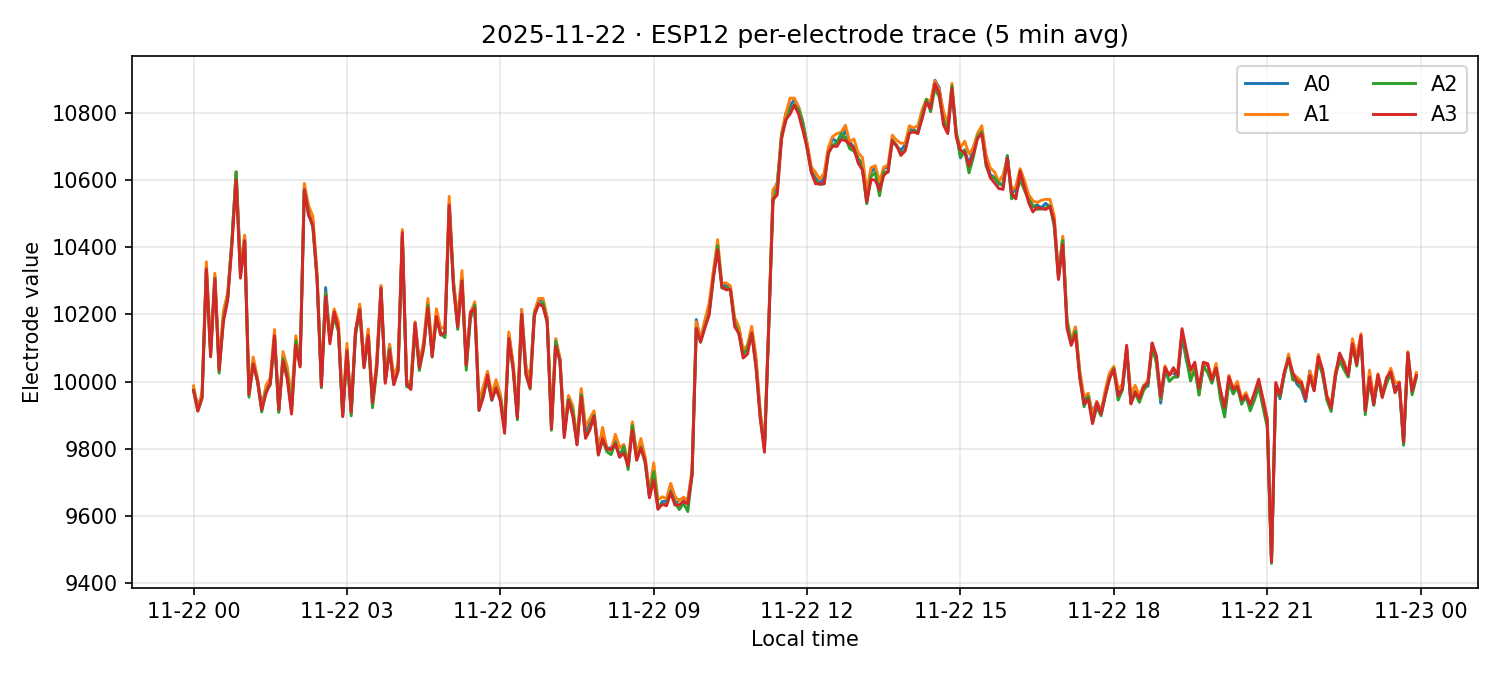
22 Nov 2025
| Electrode | Samples |
|---|---|
| A0 | 40,487 |
| A1 | 40,487 |
| A2 | 40,487 |
| A3 | 40,487 |
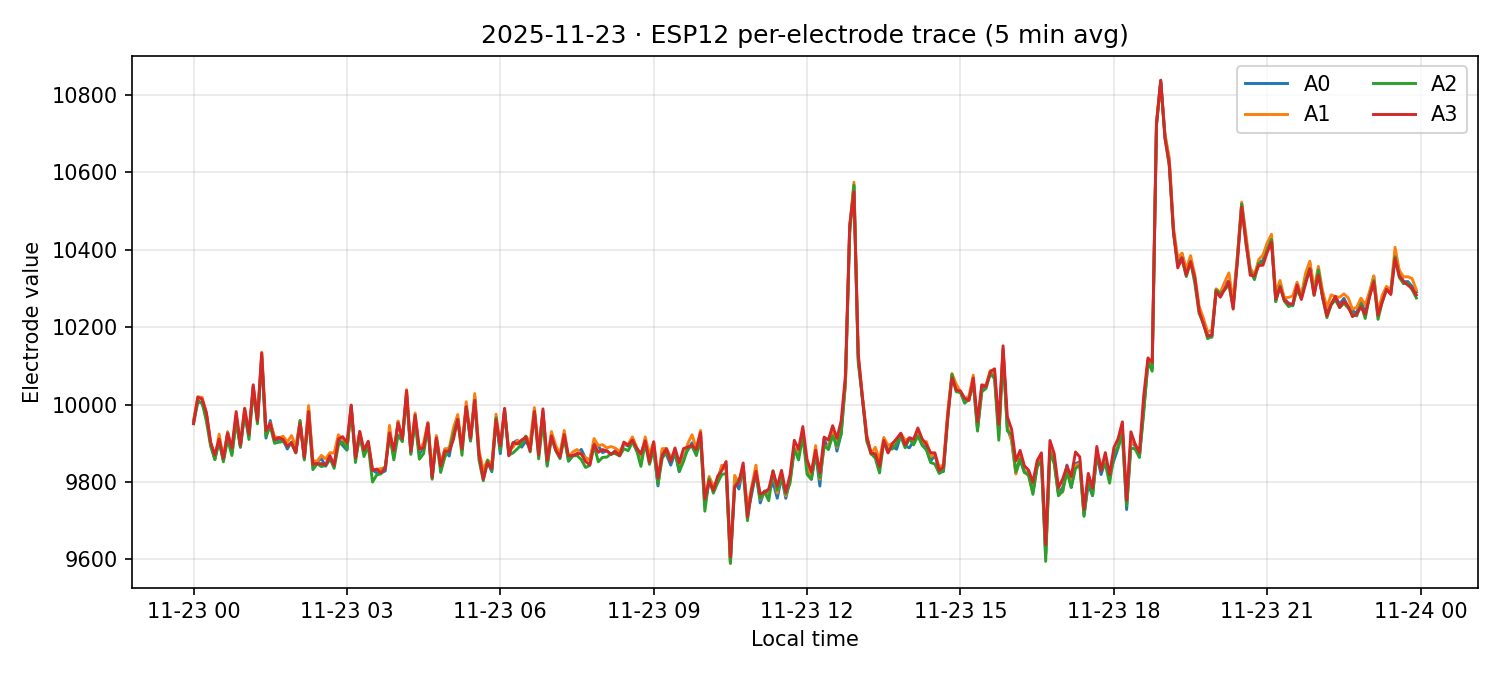
23 Nov 2025
| Electrode | Samples |
|---|---|
| A0 | 41,062 |
| A1 | 41,062 |
| A2 | 41,062 |
| A3 | 41,062 |
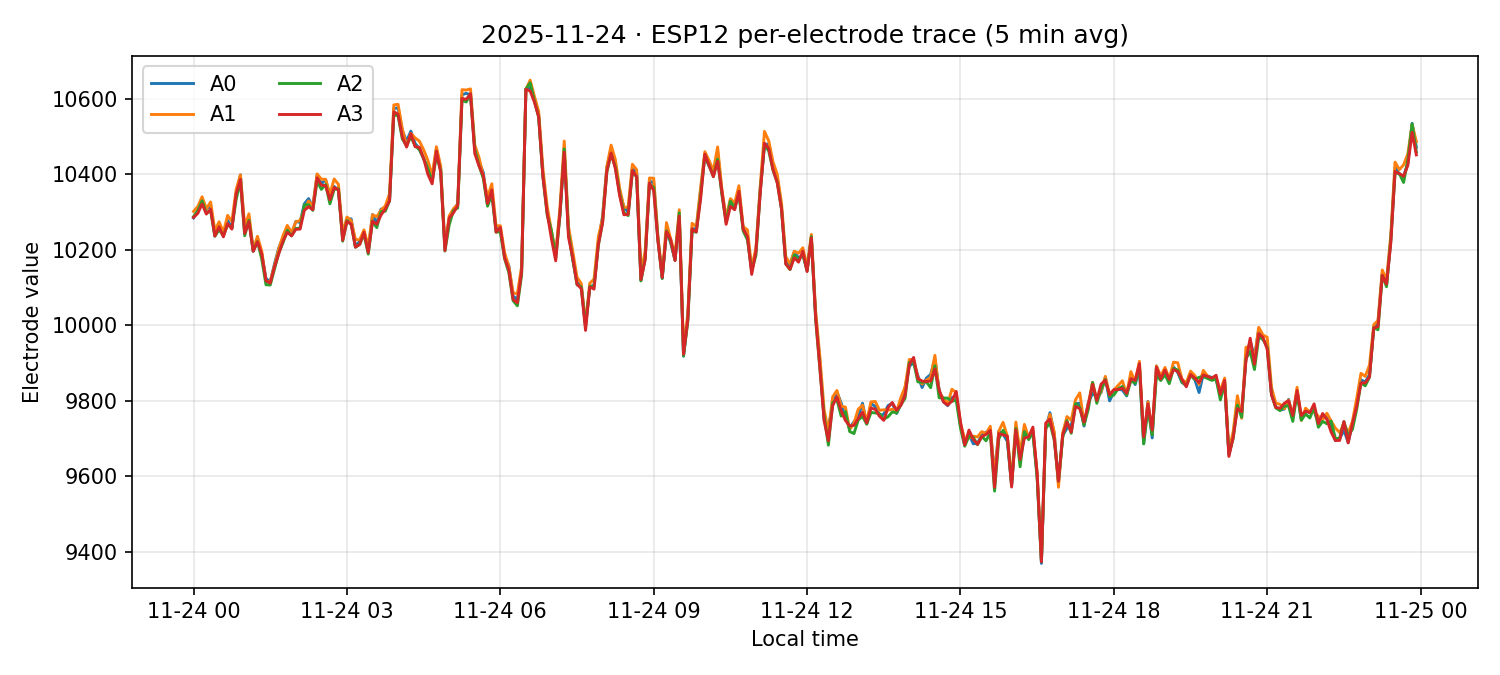
24 Nov 2025
| Electrode | Samples |
|---|---|
| A0 | 38,063 |
| A1 | 38,063 |
| A2 | 38,063 |
| A3 | 38,063 |
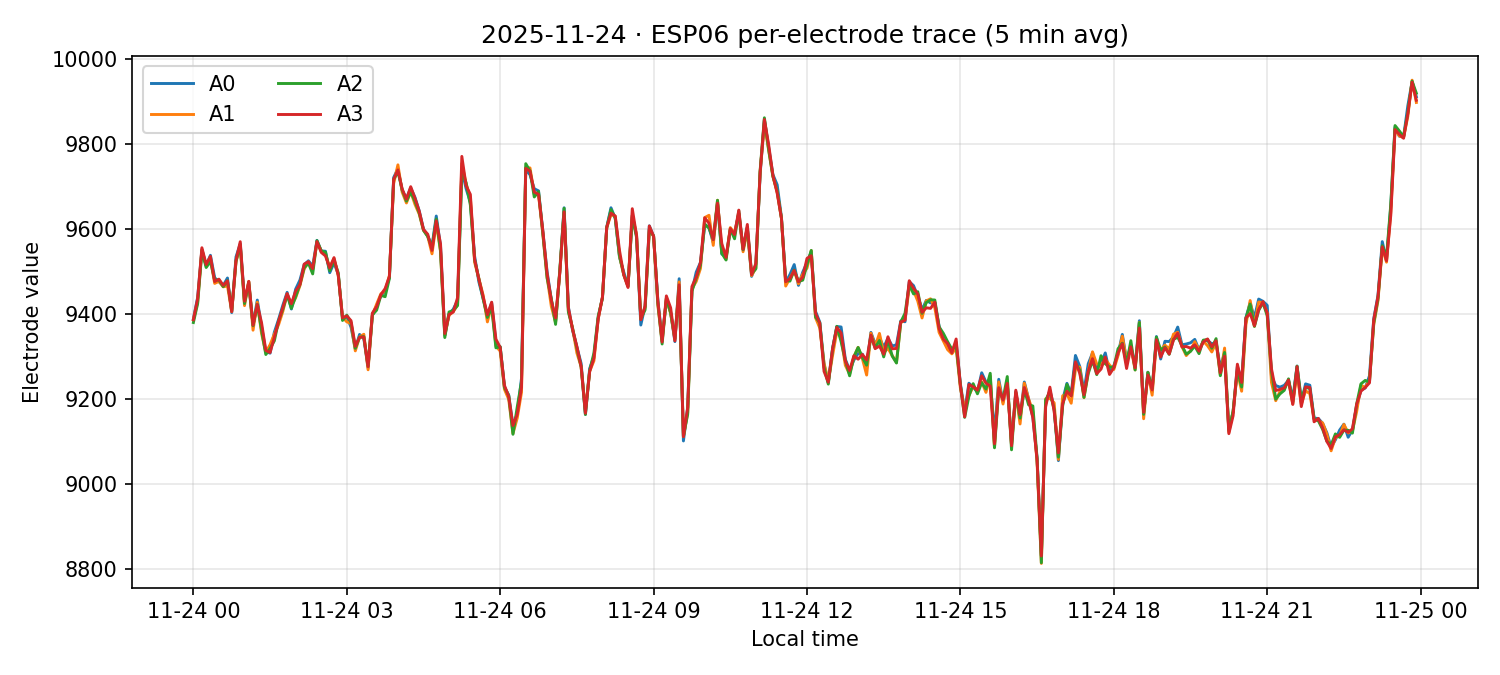
25 Nov 2025
| Electrode | Samples |
|---|---|
| A0 | 38,093 |
| A1 | 38,093 |
| A2 | 38,093 |
| A3 | 38,093 |
26 Nov 2025
| Electrode | Samples |
|---|---|
| A0 | 27,321 |
| A1 | 27,321 |
| A2 | 27,321 |
| A3 | 27,321 |
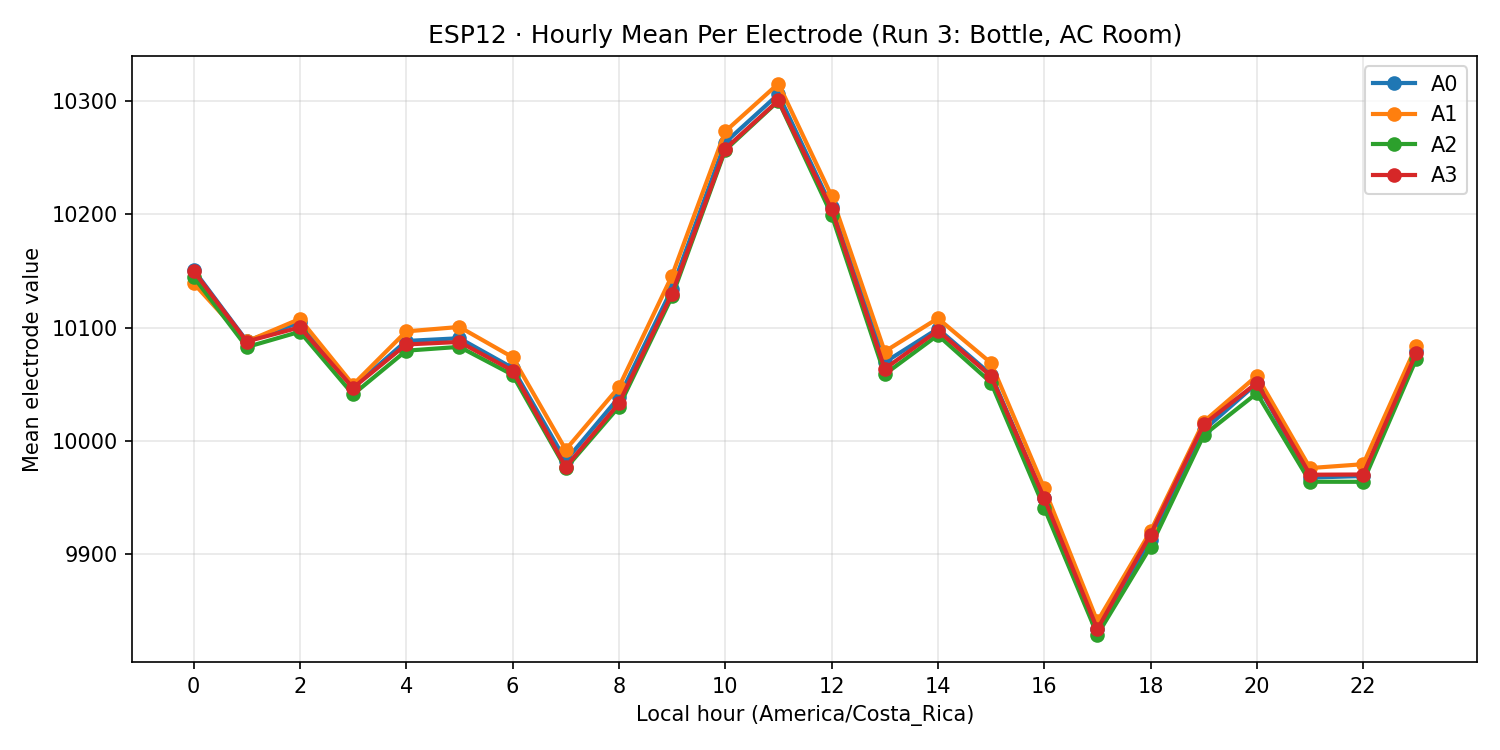

Temperature Fluctuation Analysis: Outdoor vs AC Room
Objective. Quantify the reduction in diurnal fluctuations when moving from outdoor (Run 2) to temperature-controlled indoor (Run 3) conditions. This addresses the "Temperature-Controlled Saline Repeat" future experiment proposed in the main analysis library.
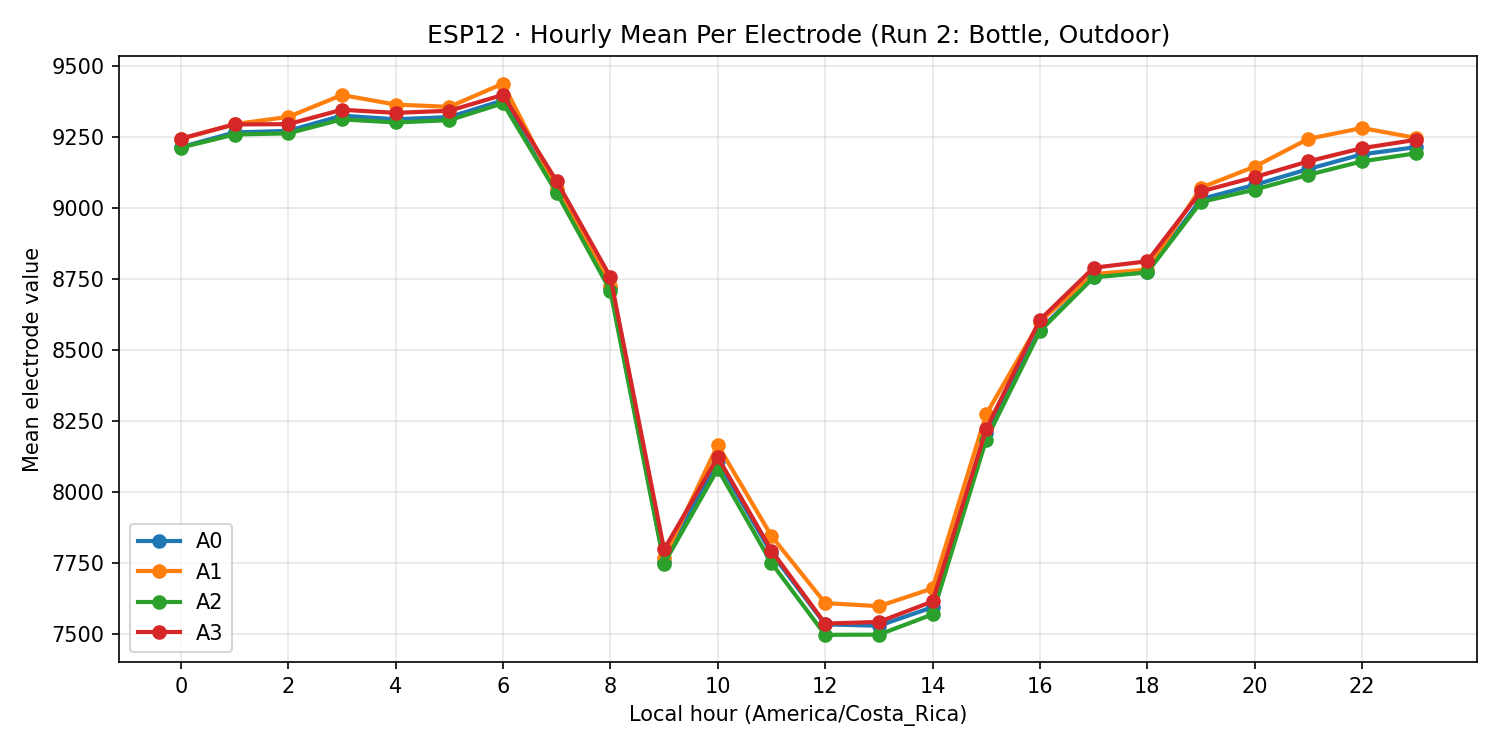
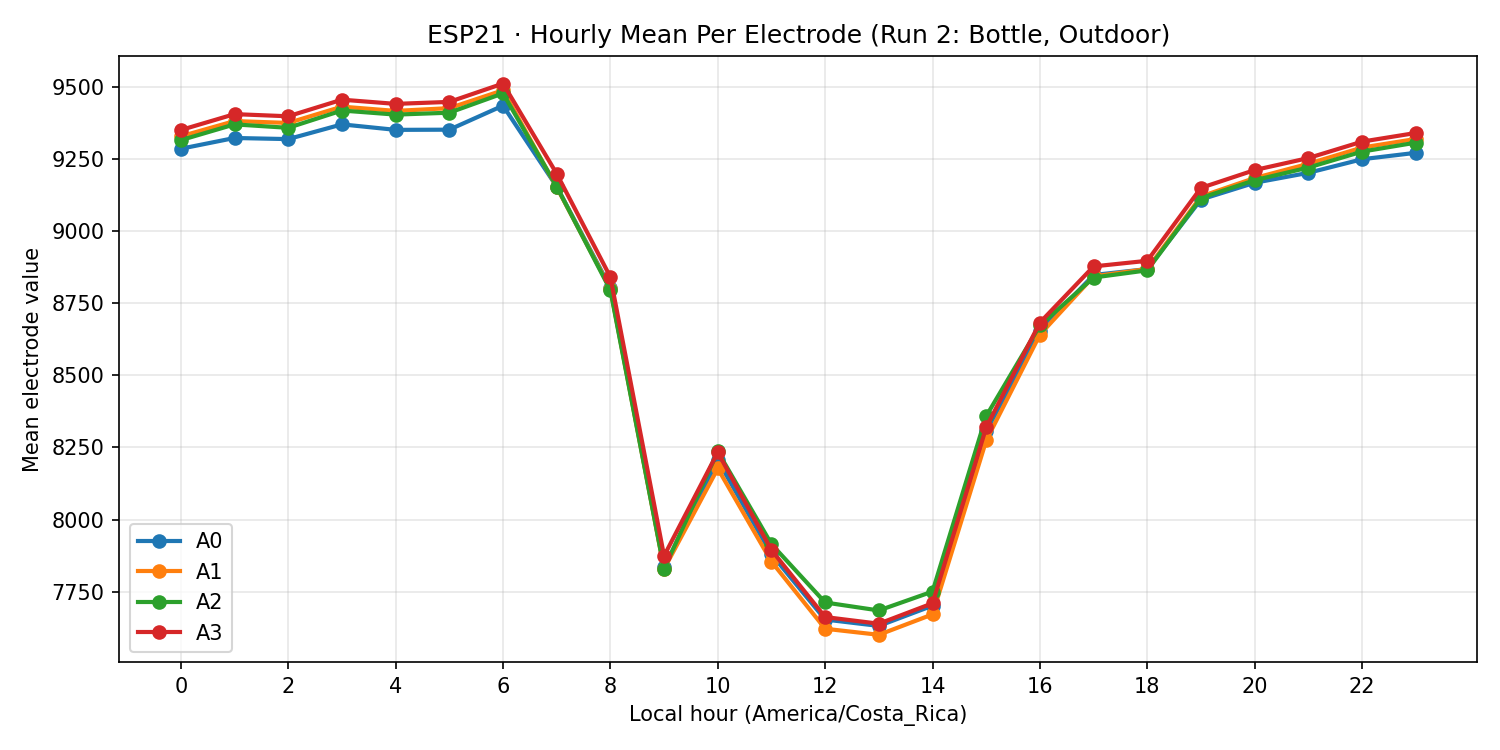
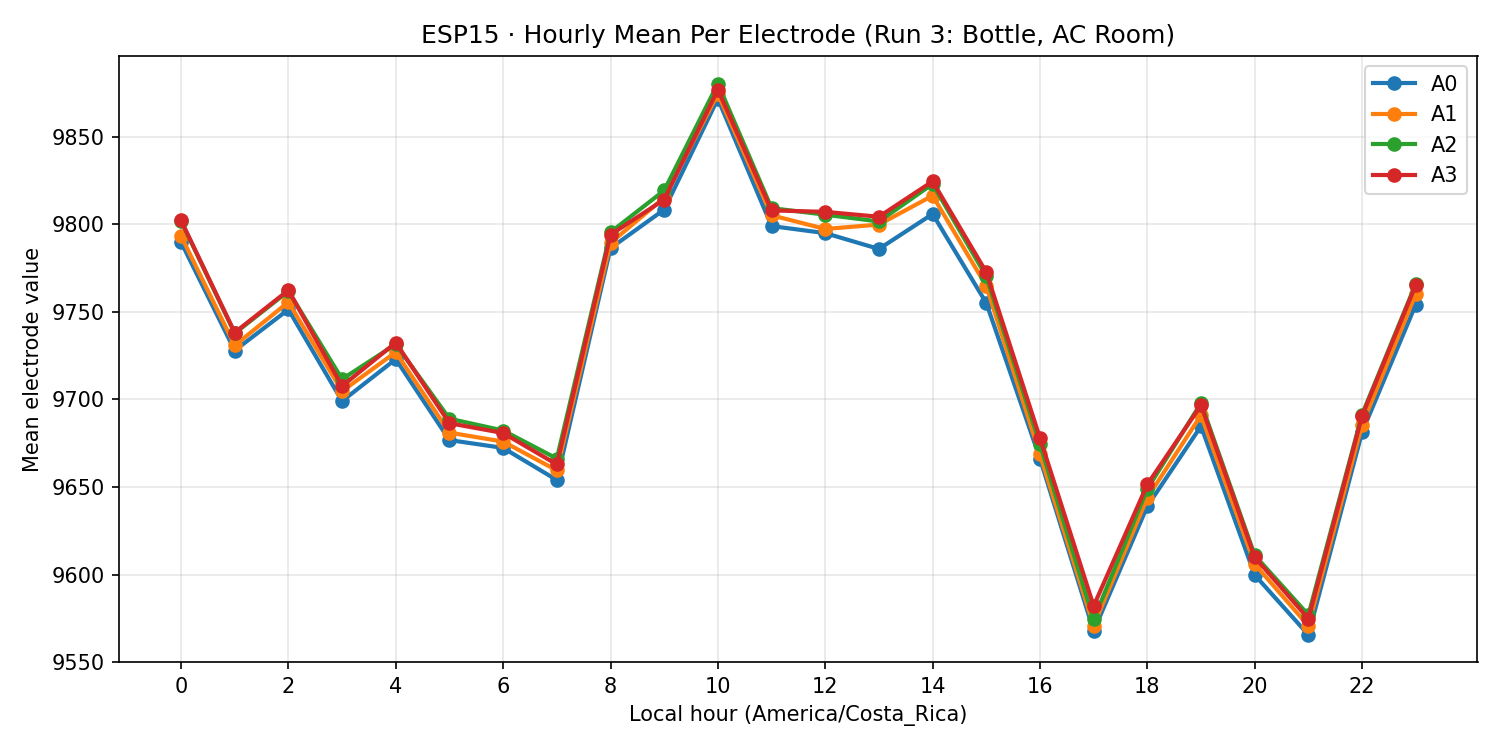
To quantify the effect of temperature control on electrode fluctuations, we calculated the distribution of hourly mean values over 24 hours for both Run 2 (bottle, outdoor) and Run 3 (bottle, AC room). The metrics below measure how much the hourly means vary across the day:
Fluctuation Metrics Comparison
| Metric | Run 2 (Outdoor) | Run 3 (AC Room) | Reduction |
|---|---|---|---|
| Std of hourly means Measures spread of hourly averages |
544.47 | 96.03 | 82.4% |
| Range of hourly means Max - min across 24 hours |
1,521.38 | 395.90 | 74.0% |
| Coefficient of Variation Normalized measure (std/mean) |
0.0623 | 0.0097 | 84.4% |
Per-ESP Breakdown
| ESP | Run 2 Std | Run 3 Std | Reduction |
|---|---|---|---|
| ESP06 | 603.26 | 90.02 | 85.1% |
| ESP12 | 657.41 | 104.51 | 84.1% |
| ESP15 | 266.81 | 81.00 | 69.6% |
| ESP21 | 650.41 | 108.59 | 83.3% |
Conclusion. Moving from outdoor (Run 2) to temperature-controlled indoor (Run 3) conditions results in a 74–84% reduction in diurnal fluctuations across all measured metrics. This provides strong quantitative evidence that ambient temperature fluctuations and evaporation drive the "noon dip" patterns observed in outdoor saline controls.
Implications. While the AC room conditions are not perfectly controlled (temperature still varies somewhat), the dramatic reduction in fluctuations suggests that in a fully temperature-controlled environment with constant temperature maintained throughout 24 hours, we would expect even less fluctuation. This validates the hypothesis that the diurnal patterns in outdoor saline controls are primarily environmental artifacts rather than biological signals.
Future work. A fully thermostated saline control with constant temperature would provide an even cleaner hardware baseline, but the current data already demonstrates that temperature control substantially reduces the fluctuations observed in outdoor conditions.